## Multi-Panel Line Chart: Model Performance Across Tasks
### Overview
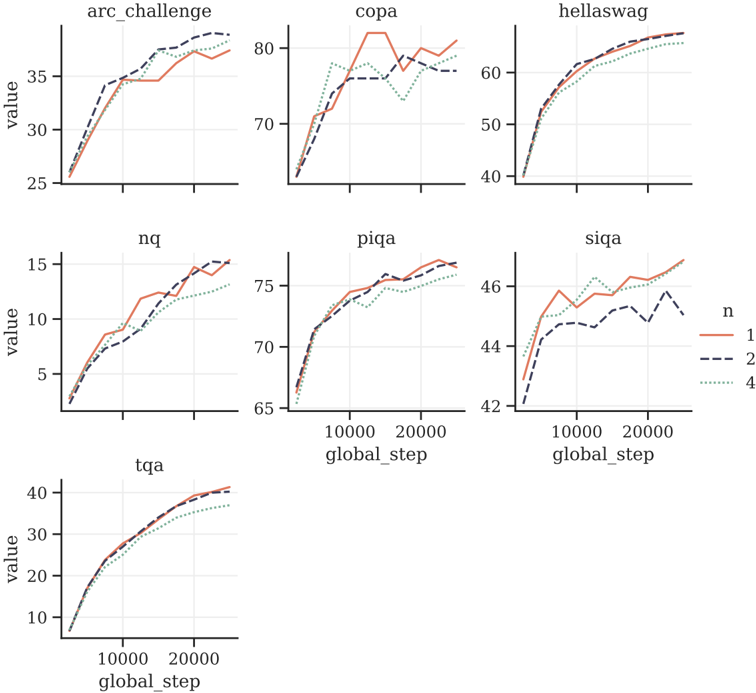
The image displays a grid of seven line charts, each plotting the performance (labeled "value") of a model or system over training steps ("global_step") for different natural language processing or reasoning tasks. The charts compare three experimental conditions, denoted by the parameter `n` (n=1, n=2, n=4). The overall visual suggests an analysis of how scaling or a specific hyperparameter (`n`) affects learning curves across diverse benchmarks.
### Components/Axes
* **Chart Grid:** 7 individual line charts arranged in 3 rows (3 charts, 3 charts, 1 chart).
* **Chart Titles (Top of each panel):** `arc_challenge`, `copa`, `hellaswag`, `nq`, `piqa`, `siqa`, `tqa`.
* **X-Axis (Common):** Labeled `global_step`. Major tick marks are present at 0, 10000, and 20000. The axis spans approximately 0 to 25,000 steps.
* **Y-Axis (Variable):** Labeled `value` for all charts. The scale and range differ per chart:
* `arc_challenge`: ~25 to ~38
* `copa`: ~65 to ~83
* `hellaswag`: ~40 to ~65
* `nq`: ~0 to ~16
* `piqa`: ~65 to ~77
* `siqa`: ~42 to ~47
* `tqa`: ~5 to ~42
* **Legend (Position: Right side, vertically centered):**
* `n` (parameter name)
* `1`: Solid orange line.
* `2`: Dashed dark blue line.
* `4`: Dotted teal/green line.
### Detailed Analysis
**Trend Verification & Data Point Extraction (Approximate values):**
1. **`arc_challenge` (Top-Left):**
* **Trend:** All three lines show a steep initial rise that plateaus after ~10,000 steps. The `n=1` (orange) and `n=2` (blue dashed) lines are very close, ending near 37. The `n=4` (teal dotted) line is consistently slightly lower, ending near 36.
* **Points (Step ~25k):** n=1 ≈ 37, n=2 ≈ 37, n=4 ≈ 36.
2. **`copa` (Top-Center):**
* **Trend:** Volatile performance. `n=1` (orange) peaks early (~82), dips, and recovers to ~80. `n=2` (blue dashed) rises steadily to ~78. `n=4` (teal dotted) shows a significant dip around step 15,000 before recovering to ~79.
* **Points (Step ~25k):** n=1 ≈ 80, n=2 ≈ 78, n=4 ≈ 79.
3. **`hellaswag` (Top-Right):**
* **Trend:** Smooth, converging logarithmic growth. All lines follow a very similar path, tightly clustered. They approach a value of ~65.
* **Points (Step ~25k):** n=1 ≈ 65, n=2 ≈ 65, n=4 ≈ 64.
4. **`nq` (Middle-Left):**
* **Trend:** Steady, near-linear growth. `n=1` (orange) and `n=2` (blue dashed) are intertwined and finish highest. `n=4` (teal dotted) grows more slowly and ends lower.
* **Points (Step ~25k):** n=1 ≈ 15, n=2 ≈ 15, n=4 ≈ 13.
5. **`piqa` (Middle-Center):**
* **Trend:** Rapid initial growth followed by a slow, steady increase. The three lines are closely grouped, with `n=1` (orange) often slightly above the others.
* **Points (Step ~25k):** n=1 ≈ 76, n=2 ≈ 75.5, n=4 ≈ 75.
6. **`siqa` (Middle-Right):**
* **Trend:** `n=1` (orange) shows a clear lead throughout, ending highest. `n=4` (teal dotted) is in the middle. `n=2` (blue dashed) is the most volatile and ends the lowest.
* **Points (Step ~25k):** n=1 ≈ 47, n=4 ≈ 46, n=2 ≈ 45.
7. **`tqa` (Bottom-Left):**
* **Trend:** Smooth, converging growth similar to `hellaswag`. All lines are tightly clustered, approaching ~40. `n=4` (teal dotted) is marginally lower.
* **Points (Step ~25k):** n=1 ≈ 40, n=2 ≈ 40, n=4 ≈ 38.
### Key Observations
* **Performance Hierarchy is Task-Dependent:** There is no universal "best" `n`. `n=1` performs best on `siqa` and is competitive on most others. `n=2` is often tied with `n=1`. `n=4` is frequently the lowest performer, most notably on `nq` and `arc_challenge`.
* **Convergence vs. Divergence:** On tasks like `hellaswag` and `tqa`, all conditions converge to similar final performance. On `siqa` and `nq`, the performance gap between conditions is more pronounced and sustained.
* **Volatility:** The `copa` and `siqa` charts show more volatility (ups and downs) in the learning curves compared to the smoother trajectories of `hellaswag` and `tqa`.
* **Learning Phases:** Most charts show a distinct phase of rapid improvement in the first ~5,000-10,000 steps, followed by a slower refinement phase.
### Interpretation
This set of charts likely comes from an ablation study investigating the effect of a hyperparameter `n` (which could represent number of shots, ensemble size, beam width, or a similar scaling factor) on model training across a diverse evaluation suite.
The data suggests that **increasing `n` does not guarantee better performance and can sometimes be detrimental.** The optimal value of `n` is highly sensitive to the specific task. For tasks requiring precise reasoning or knowledge (`nq`, `arc_challenge`), a lower `n` (1 or 2) appears sufficient or better. For more commonsense or linguistic tasks (`hellaswag`, `tqa`), the model is robust to changes in `n`.
The volatility in `copa` and `siqa` might indicate these tasks are more sensitive to training dynamics or that the model's performance on them is less stable. The consistent underperformance of `n=4` on several tasks could point to overfitting, optimization difficulties, or a mismatch between the increased capacity/complexity implied by `n=4` and the nature of those specific benchmarks.
In summary, the visualization argues for careful, task-specific tuning of the parameter `n` rather than assuming a simple "more is better" scaling law. It highlights the importance of evaluating models across a broad benchmark suite to understand the nuanced impact of architectural or training choices.