## Line Charts: Variance Score on LongBench
### Overview
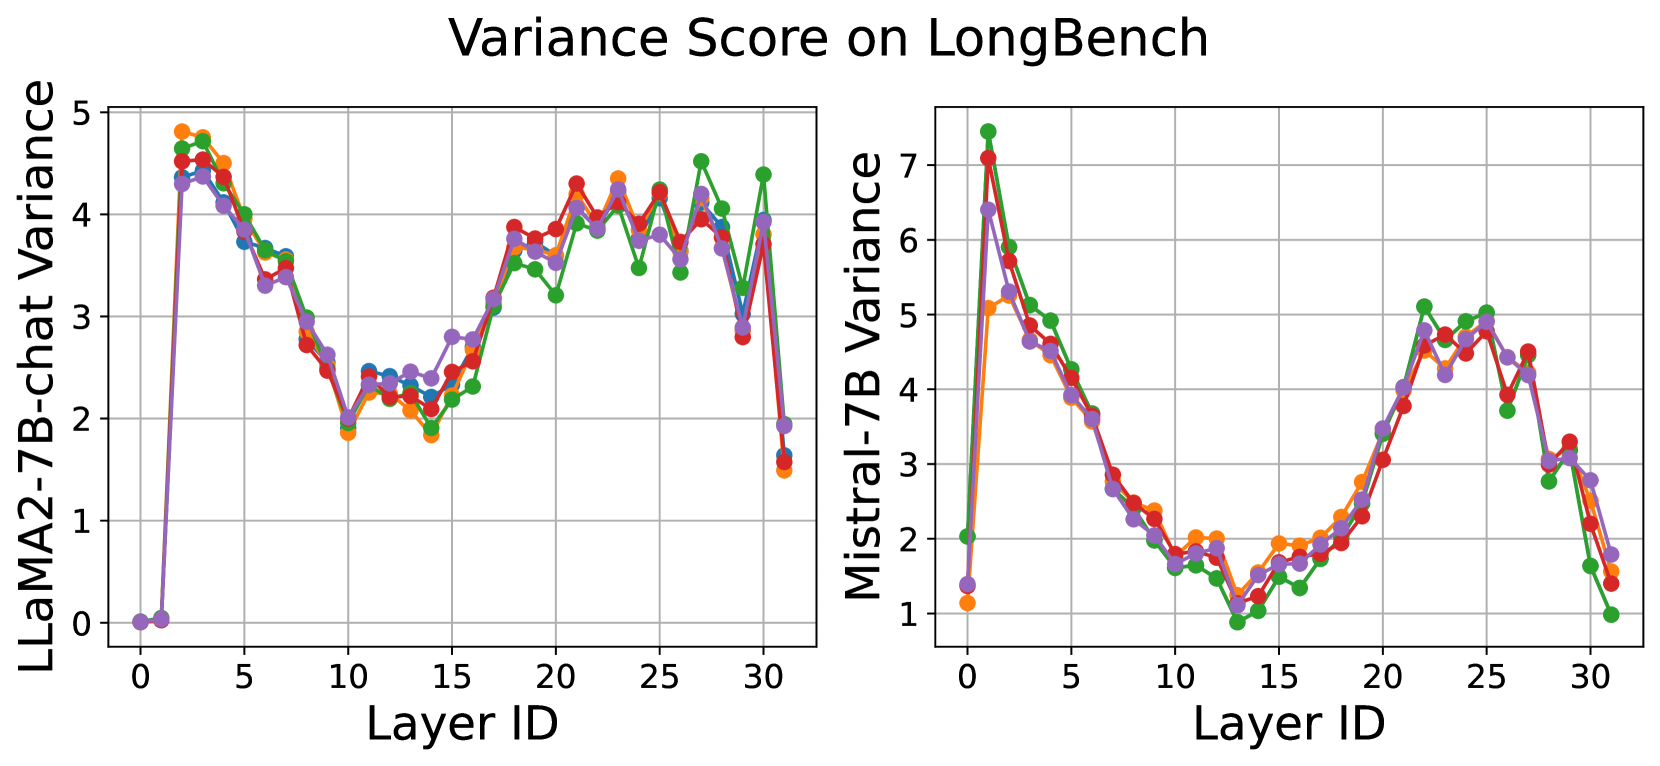
Two line charts compare variance scores across 31 layers (Layer ID 0–30) for two language models: LLaMA2-7B-chat and Mistral-7B. Each chart shows variance trends for original and fine-tuned configurations, with distinct color-coded lines for each model and configuration.
### Components/Axes
- **X-axis**: Layer ID (0–30, integer increments).
- **Left Y-axis (LLaMA2-7B-chat Variance)**: Scale 0–5.
- **Right Y-axis (Mistral-7B Variance)**: Scale 1–7.
- **Legends**: Located on the right side of each chart, with four entries:
- Red: LLaMA2-7B-chat (Original)
- Green: LLaMA2-7B-chat (Fine-tuned)
- Blue: Mistral-7B (Original)
- Purple: Mistral-7B (Fine-tuned)
### Detailed Analysis
#### LLaMA2-7B-chat Variance (Left Chart)
- **Original (Red)**: Starts at 0, spikes to ~4.8 at Layer 1, then fluctuates between 2.0–4.5, ending at ~1.5 at Layer 30.
- **Fine-tuned (Green)**: Starts at 0, peaks at ~4.5 at Layer 1, then fluctuates between 1.8–4.2, ending at ~1.8 at Layer 30.
- **Mistral-7B Original (Blue)**: Starts at 0, peaks at ~4.6 at Layer 1, then fluctuates between 2.1–4.4, ending at ~1.6 at Layer 30.
- **Mistral-7B Fine-tuned (Purple)**: Starts at 0, peaks at ~4.3 at Layer 1, then fluctuates between 1.9–4.1, ending at ~1.7 at Layer 30.
#### Mistral-7B Variance (Right Chart)
- **Original (Red)**: Starts at 7.2, drops sharply to ~1.0 at Layer 10, then fluctuates between 1.5–3.0, ending at ~1.2 at Layer 30.
- **Fine-tuned (Green)**: Starts at 6.5, drops to ~1.2 at Layer 10, then fluctuates between 1.8–3.2, ending at ~1.5 at Layer 30.
- **LLaMA2-7B-chat Original (Blue)**: Starts at 6.8, drops to ~1.1 at Layer 10, then fluctuates between 1.4–3.1, ending at ~1.3 at Layer 30.
- **LLaMA2-7B-chat Fine-tuned (Purple)**: Starts at 6.3, drops to ~1.0 at Layer 10, then fluctuates between 1.6–3.0, ending at ~1.4 at Layer 30.
### Key Observations
1. **Initial Spike**: All models show a sharp variance increase at Layer 1, followed by gradual decline.
2. **Fine-tuning Impact**: Fine-tuned models generally exhibit lower variance than original versions across most layers.
3. **Mistral-7B Dominance**: Mistral-7B models consistently show higher variance scores than LLaMA2-7B-chat in both original and fine-tuned configurations.
4. **Layer 30 Drop**: All lines end with a significant drop in variance at Layer 30, suggesting architectural or training differences in later layers.
### Interpretation
The variance scores reflect layer-wise consistency in model outputs. Higher variance indicates greater instability or unpredictability in model behavior.
- **Fine-tuning Effect**: Reduces variance in both models, implying improved stability post-fine-tuning.
- **Model Architecture**: Mistral-7B’s higher variance suggests differences in layer design or training objectives compared to LLaMA2-7B-chat.
- **Layer 30 Anomaly**: The abrupt drop at Layer 30 may indicate a specialized or final processing layer with distinct behavior.
This analysis highlights how model architecture and fine-tuning influence layer-wise performance consistency, with implications for deployment in tasks requiring predictable outputs.