## Line Chart: % of Parameters vs Explained Variance Retained
### Overview
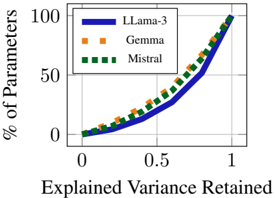
The chart compares the efficiency of three language models (LLama-3, Gemma, Mistral) in retaining explained variance relative to their parameter count. The x-axis represents "Explained Variance Retained" (0 to 1), and the y-axis shows "% of Parameters" (0 to 100). All models exhibit an upward trend, with LLama-3 achieving the steepest slope, followed by Mistral and Gemma.
### Components/Axes
- **X-axis**: "Explained Variance Retained" (0 to 1, linear scale).
- **Y-axis**: "% of Parameters" (0 to 100, linear scale).
- **Legend**: Top-left corner, with:
- **Blue solid line**: LLama-3.
- **Orange dashed line**: Gemma.
- **Green dotted line**: Mistral.
### Detailed Analysis
1. **LLama-3 (Blue)**:
- At 0.5 explained variance, ~40% of parameters are used.
- At 1.0 explained variance, ~100% of parameters are used.
- Slope: Steepest among all models, indicating high efficiency.
2. **Mistral (Green)**:
- At 0.5 explained variance, ~35% of parameters are used.
- At 1.0 explained variance, ~100% of parameters are used.
- Slope: Moderate, less efficient than LLama-3 but more than Gemma.
3. **Gemma (Orange)**:
- At 0.5 explained variance, ~30% of parameters are used.
- At 1.0 explained variance, ~100% of parameters are used.
- Slope: Shallowest, least efficient in parameter utilization.
All lines originate at (0,0) and converge at (1,100), confirming that 100% of parameters are required to retain 100% variance.
### Key Observations
- **Efficiency Hierarchy**: LLama-3 > Mistral > Gemma in retaining variance per parameter.
- **Convergence**: All models require full parameter utilization to achieve maximum variance retention.
- **Scaling**: LLama-3 achieves ~40% variance retention with ~40% of its parameters, while Mistral and Gemma require ~35% and ~30%, respectively, for the same retention.
### Interpretation
The chart demonstrates that **LLama-3** is the most parameter-efficient model, achieving higher variance retention with fewer parameters compared to Mistral and Gemma. This suggests LLama-3 could be preferable for applications prioritizing efficiency (e.g., edge computing). Mistral and Gemma, while less efficient, may still be viable depending on resource constraints. The convergence at (1,100) implies no model inherently outperforms others in absolute performance—efficiency is the key differentiator. The data underscores a trade-off between model size and performance, critical for deployment decisions in resource-limited environments.