## Chart: Explained Variance Retained vs. % of Parameters
### Overview
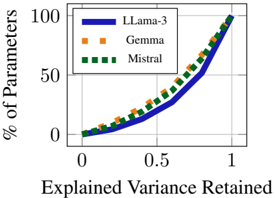
The image is a line chart comparing the percentage of parameters retained versus the explained variance retained for three different models: LLaMA-3, Gemma, and Mistral. The x-axis represents the explained variance retained, ranging from 0 to 1. The y-axis represents the percentage of parameters, ranging from 0 to 100.
### Components/Axes
* **X-axis:** Explained Variance Retained (0 to 1)
* **Y-axis:** % of Parameters (0 to 100)
* **Legend:** Located in the top-left corner.
* LLaMA-3 (solid blue line)
* Gemma (dashed orange line)
* Mistral (dashed green line)
### Detailed Analysis
* **LLaMA-3 (solid blue line):**
* The line starts at approximately (0, 0).
* At x = 0.5, y is approximately 25.
* At x = 1, y is approximately 100.
* The line slopes upward, indicating that as the explained variance retained increases, the percentage of parameters also increases.
* **Gemma (dashed orange line):**
* The line starts at approximately (0, 0).
* At x = 0.5, y is approximately 35.
* At x = 1, y is approximately 90.
* The line slopes upward, indicating that as the explained variance retained increases, the percentage of parameters also increases.
* **Mistral (dashed green line):**
* The line starts at approximately (0, 0).
* At x = 0.5, y is approximately 30.
* At x = 1, y is approximately 100.
* The line slopes upward, indicating that as the explained variance retained increases, the percentage of parameters also increases.
### Key Observations
* All three models show a positive correlation between explained variance retained and the percentage of parameters.
* Gemma requires a higher percentage of parameters to retain the same explained variance compared to LLaMA-3 and Mistral, especially in the range of 0 to 0.5 explained variance retained.
* LLaMA-3 requires the lowest percentage of parameters to retain the same explained variance compared to Gemma and Mistral, especially in the range of 0 to 0.5 explained variance retained.
* Mistral and LLaMA-3 are very similar.
### Interpretation
The chart illustrates the trade-off between model size (percentage of parameters) and performance (explained variance retained). It suggests that LLaMA-3 is more efficient in retaining explained variance with a smaller percentage of parameters compared to Gemma. Mistral is similar to LLaMA-3. This could indicate that LLaMA-3 has a more optimized architecture or training process for capturing the variance in the data. The data suggests that for a given level of explained variance, LLaMA-3 requires fewer parameters, potentially leading to a more compact and efficient model.