\n
## Chart: Explained Variance Retained vs. % of Parameters
### Overview
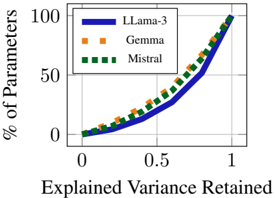
The image presents a chart illustrating the relationship between the percentage of parameters retained and the explained variance for three different models: Llama-3, Gemma, and Mistral. The chart appears to be a cumulative distribution function, showing how much variance is explained as more parameters are included.
### Components/Axes
* **X-axis:** "Explained Variance Retained" - Scale ranges from 0 to 1.
* **Y-axis:** "% of Parameters" - Scale ranges from 0 to 100.
* **Legend:** Located in the top-left corner.
* Llama-3 (represented by a solid blue line)
* Gemma (represented by an orange dashed line)
* Mistral (represented by a green dashed line with square markers)
* **Gridlines:** Present to aid in reading values.
### Detailed Analysis
The chart shows three curves, each representing one of the models. All three curves start at approximately (0, 0) and end near (1, 100).
* **Llama-3 (Blue Line):** The curve slopes upward, starting relatively flat and then becoming steeper.
* At Explained Variance Retained = 0.2, approximately 20% of Parameters are retained.
* At Explained Variance Retained = 0.5, approximately 40% of Parameters are retained.
* At Explained Variance Retained = 0.8, approximately 75% of Parameters are retained.
* At Explained Variance Retained = 1.0, approximately 98% of Parameters are retained.
* **Gemma (Orange Dashed Line):** The curve also slopes upward, but is generally above the Llama-3 curve.
* At Explained Variance Retained = 0.2, approximately 25% of Parameters are retained.
* At Explained Variance Retained = 0.5, approximately 50% of Parameters are retained.
* At Explained Variance Retained = 0.8, approximately 80% of Parameters are retained.
* At Explained Variance Retained = 1.0, approximately 99% of Parameters are retained.
* **Mistral (Green Dashed Line with Square Markers):** The curve is generally between Llama-3 and Gemma.
* At Explained Variance Retained = 0.2, approximately 22% of Parameters are retained.
* At Explained Variance Retained = 0.5, approximately 45% of Parameters are retained.
* At Explained Variance Retained = 0.8, approximately 78% of Parameters are retained.
* At Explained Variance Retained = 1.0, approximately 97% of Parameters are retained.
### Key Observations
* All three models demonstrate a positive correlation between explained variance retained and the percentage of parameters.
* Gemma appears to achieve a higher explained variance with fewer parameters compared to Llama-3.
* Mistral falls between Llama-3 and Gemma in terms of explained variance for a given percentage of parameters.
* The curves show diminishing returns; as more parameters are added, the increase in explained variance becomes smaller.
### Interpretation
This chart likely represents a Principal Component Analysis (PCA) or similar dimensionality reduction technique applied to the parameters of these language models. The x-axis represents the proportion of variance in the model's parameters that is captured by retaining a certain percentage of those parameters (y-axis).
The fact that all three curves approach 100% at an explained variance of 1 suggests that all parameters contribute to the model's overall variance, but to varying degrees. Gemma appears to be more efficient in capturing variance with fewer parameters, indicating a potentially more compact or well-structured parameter space. Llama-3 requires more parameters to achieve the same level of explained variance. Mistral is somewhere in between.
This information could be used to assess the efficiency of each model and potentially guide parameter pruning or compression strategies. A steeper curve indicates that a smaller subset of parameters can capture a significant portion of the model's variance, making it a more efficient model.