## Line Chart: Surprisal vs. Training Steps
### Overview
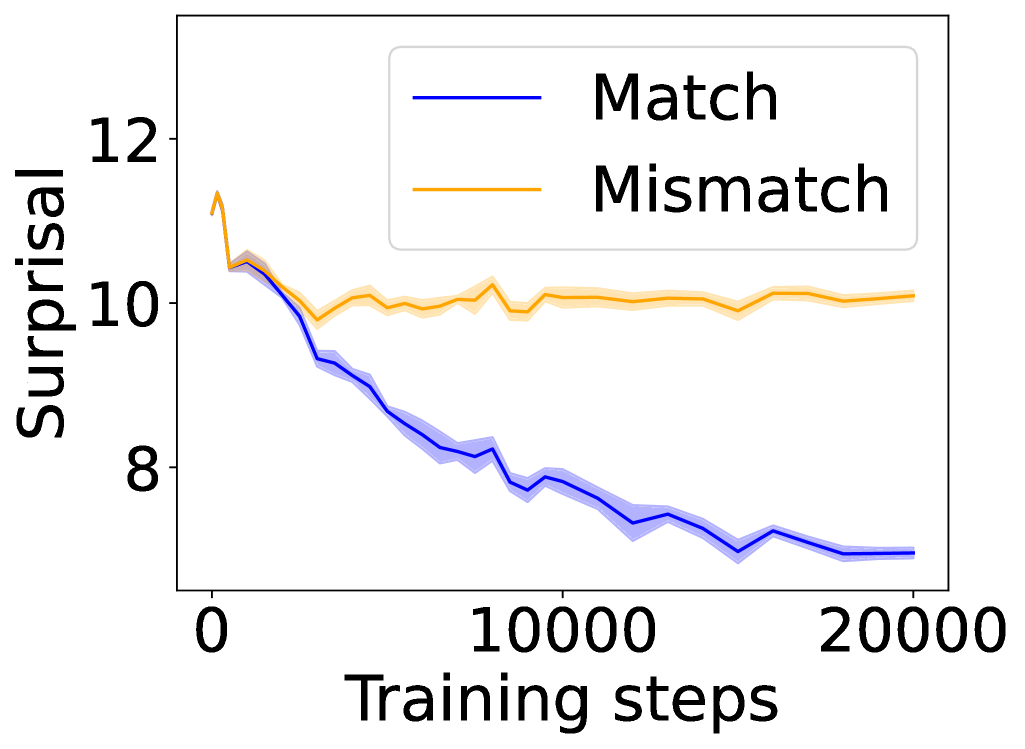
The image is a line chart comparing the surprisal values for "Match" and "Mismatch" conditions over a range of training steps. The x-axis represents training steps, ranging from 0 to 20000. The y-axis represents surprisal, ranging from approximately 6 to 12. The chart displays two lines, one blue ("Match") and one orange ("Mismatch"), each with a shaded region indicating variability.
### Components/Axes
* **X-axis:**
* Label: "Training steps"
* Scale: 0 to 20000
* Markers: 0, 10000, 20000
* **Y-axis:**
* Label: "Surprisal"
* Scale: 8 to 12
* Markers: 8, 10, 12
* **Legend (Top-Right):**
* "Match": Blue line
* "Mismatch": Orange line
### Detailed Analysis
* **Match (Blue Line):**
* Trend: The "Match" line generally slopes downward, indicating a decrease in surprisal as training steps increase.
* Data Points:
* At 0 training steps, surprisal is approximately 10.5.
* At 5000 training steps, surprisal is approximately 8.5.
* At 10000 training steps, surprisal is approximately 7.8.
* At 15000 training steps, surprisal is approximately 7.2.
* At 20000 training steps, surprisal is approximately 7.0.
* **Mismatch (Orange Line):**
* Trend: The "Mismatch" line remains relatively stable, with a slight initial decrease followed by a plateau.
* Data Points:
* At 0 training steps, surprisal is approximately 11.2.
* At 5000 training steps, surprisal is approximately 10.0.
* At 10000 training steps, surprisal is approximately 10.2.
* At 15000 training steps, surprisal is approximately 10.0.
* At 20000 training steps, surprisal is approximately 10.1.
### Key Observations
* The "Match" condition shows a significant decrease in surprisal over the training steps, suggesting that the model learns to better predict matching pairs.
* The "Mismatch" condition maintains a relatively constant level of surprisal, indicating that the model consistently finds mismatched pairs surprising.
* The shaded regions around each line indicate the variability or uncertainty associated with the surprisal values.
### Interpretation
The chart demonstrates that as the model undergoes training, it becomes more adept at predicting "Match" scenarios, as evidenced by the decreasing surprisal. Conversely, the model consistently finds "Mismatch" scenarios surprising, as indicated by the relatively stable surprisal values. This suggests that the model is learning to differentiate between matching and mismatched pairs, with the "Match" condition becoming more predictable over time. The variability, represented by the shaded regions, suggests that the model's performance is not uniform across all instances within each condition.