## Line Chart: Surprise vs. Training Steps
### Overview
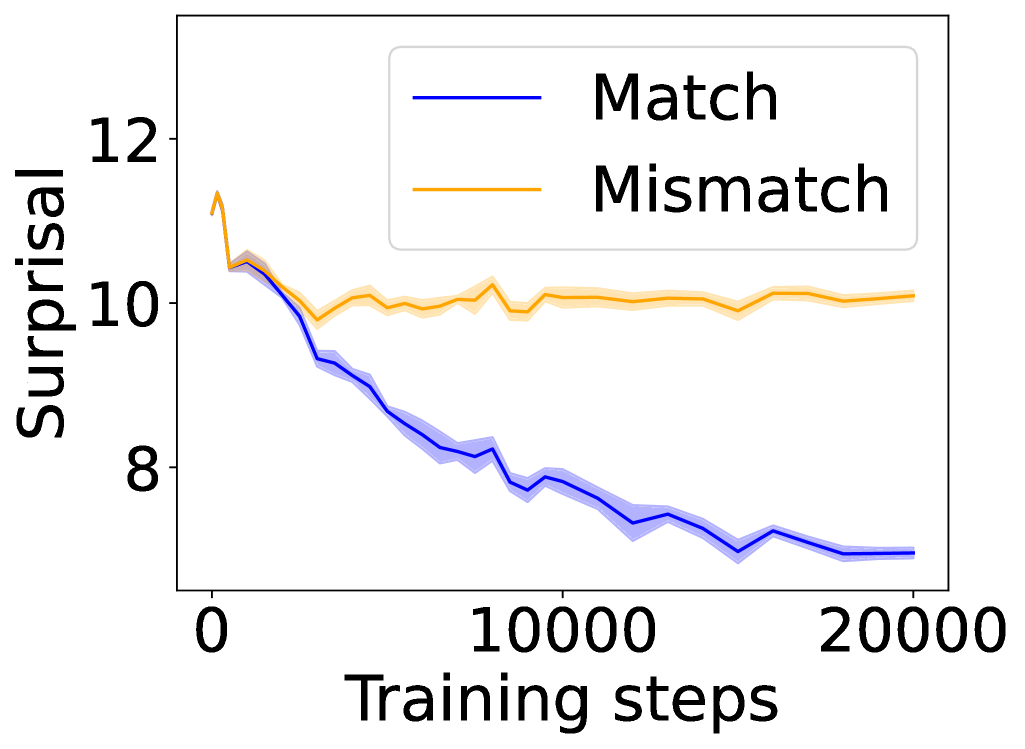
The image presents a line chart illustrating the relationship between "Surprisal" (y-axis) and "Training steps" (x-axis). Two data series are plotted: one representing "Match" conditions and the other representing "Mismatch" conditions. The chart appears to track the evolution of surprisal during a training process.
### Components/Axes
* **X-axis:** "Training steps", ranging from approximately 0 to 20000.
* **Y-axis:** "Surprisal", ranging from approximately 6 to 12.
* **Legend:** Located in the top-right corner.
* "Match" - represented by a blue line.
* "Mismatch" - represented by an orange line.
* **Data Series:** Two lines representing the "Match" and "Mismatch" conditions.
### Detailed Analysis
The "Match" line (blue) starts at approximately 10.5 and generally slopes downward, exhibiting fluctuations. The "Mismatch" line (orange) begins at approximately 11.5 and remains relatively stable, fluctuating around a value of 10.
Here's a breakdown of approximate data points, noting the inherent uncertainty in reading values from the image:
**Match (Blue Line):**
* 0 Training Steps: ~10.5 Surprisal
* 2000 Training Steps: ~9.5 Surprisal
* 4000 Training Steps: ~8.5 Surprisal
* 6000 Training Steps: ~7.8 Surprisal
* 8000 Training Steps: ~7.5 Surprisal
* 10000 Training Steps: ~7.2 Surprisal
* 12000 Training Steps: ~7.0 Surprisal
* 14000 Training Steps: ~7.2 Surprisal
* 16000 Training Steps: ~7.5 Surprisal
* 18000 Training Steps: ~7.7 Surprisal
* 20000 Training Steps: ~7.6 Surprisal
**Mismatch (Orange Line):**
* 0 Training Steps: ~11.5 Surprisal
* 2000 Training Steps: ~10.5 Surprisal
* 4000 Training Steps: ~10.2 Surprisal
* 6000 Training Steps: ~10.0 Surprisal
* 8000 Training Steps: ~10.2 Surprisal
* 10000 Training Steps: ~10.1 Surprisal
* 12000 Training Steps: ~10.3 Surprisal
* 14000 Training Steps: ~10.2 Surprisal
* 16000 Training Steps: ~10.1 Surprisal
* 18000 Training Steps: ~10.0 Surprisal
* 20000 Training Steps: ~10.1 Surprisal
### Key Observations
* The "Match" line demonstrates a clear decreasing trend in surprisal over the training steps, indicating that the model is becoming more confident in predicting matching conditions.
* The "Mismatch" line remains relatively constant, suggesting that the model's ability to predict mismatching conditions does not significantly improve with training.
* The gap between the "Match" and "Mismatch" lines widens as training progresses, indicating a growing difference in surprisal between the two conditions.
### Interpretation
The data suggests that the training process is more effective at improving the model's performance on "Match" conditions than on "Mismatch" conditions. The decreasing surprisal for "Match" indicates that the model is learning to better predict when inputs match a certain criterion. The relatively stable surprisal for "Mismatch" suggests that the model is not learning to effectively discriminate against non-matching inputs. This could indicate a bias in the training data or a limitation in the model's architecture. The widening gap between the two lines highlights the increasing disparity in performance between the two conditions as training continues. This could be a desirable outcome if the goal is to improve the model's ability to identify matching conditions, but it could also be a sign of overfitting or a lack of generalization to mismatching conditions. Further investigation would be needed to determine the underlying causes and potential solutions.