## Chart: SRT50 and SRM for Different Conditions
### Overview
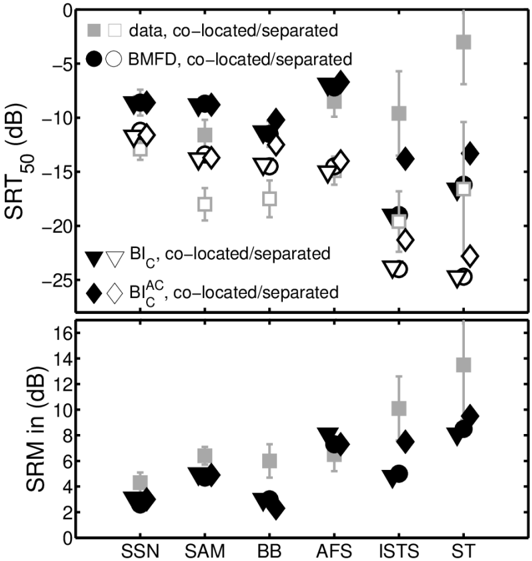
The image presents two plots stacked vertically. The top plot shows SRT50 (Speech Reception Threshold) in dB, and the bottom plot shows SRM (Speech Reception Masking) in dB, both for different auditory conditions labeled on the x-axis. Each condition has data points for four different methods: "data", "BMFD", "BI_C", and "BI_C^AC", each with co-located/separated variations. Error bars are included for some data points.
### Components/Axes
**Top Plot (SRT50):**
* **Y-axis:** SRT50 (dB), ranging from 0 to -25 dB. Axis markers are present at 0, -5, -10, -15, -20, and -25.
* **X-axis:** Categorical labels representing different conditions: SSN, SAM, BB, AFS, ISTS, ST.
* **Legend (Top-Left):**
* Gray Square: data, co-located/separated
* Black Circle: BMFD, co-located/separated
* Black Triangle (pointing down): BI_C, co-located/separated
* Black Diamond: BI_C^AC, co-located/separated
**Bottom Plot (SRM):**
* **Y-axis:** SRM in (dB), ranging from 0 to 16 dB. Axis markers are present at 0, 2, 4, 6, 8, 10, 12, 14, and 16.
* **X-axis:** Same categorical labels as the top plot: SSN, SAM, BB, AFS, ISTS, ST.
* **Legend:** The same legend as the top plot applies to the bottom plot.
### Detailed Analysis
**Top Plot (SRT50):**
* **"data" (Gray Square):**
* SSN: Approximately -11 dB,
* SAM: Approximately -11 dB,
* BB: Approximately -17 dB,
* AFS: Approximately -10 dB,
* ISTS: Approximately -11 dB,
* ST: Approximately -13 dB.
The trend is relatively flat, with a dip at BB.
* **"BMFD" (Black Circle):**
* SSN: Approximately -12 dB,
* SAM: Approximately -13 dB,
* BB: Approximately -15 dB,
* AFS: Approximately -15 dB,
* ISTS: Approximately -20 dB,
* ST: Approximately -16 dB.
The trend is generally flat, with a slight downward slope.
* **"BI_C" (Black Triangle):**
* SSN: Approximately -12 dB,
* SAM: Approximately -14 dB,
* BB: Approximately -15 dB,
* AFS: Approximately -8 dB,
* ISTS: Approximately -22 dB,
* ST: Approximately -23 dB.
The trend is decreasing, with a notable drop at ISTS and ST.
* **"BI_C^AC" (Black Diamond):**
* SSN: Approximately -12 dB,
* SAM: Approximately -14 dB,
* BB: Approximately -15 dB,
* AFS: Approximately -9 dB,
* ISTS: Approximately -15 dB,
* ST: Approximately -17 dB.
The trend is decreasing, with a drop at ISTS and ST.
**Bottom Plot (SRM):**
* **"data" (Gray Square):**
* SSN: Approximately 4 dB,
* SAM: Approximately 6 dB,
* BB: Approximately 6 dB,
* AFS: Approximately 7 dB,
* ISTS: Approximately 10 dB,
* ST: Approximately 14 dB.
The trend is increasing.
* **"BMFD" (Black Circle):**
* SSN: Approximately 4 dB,
* SAM: Approximately 5 dB,
* BB: Approximately 3 dB,
* AFS: Approximately 5 dB,
* ISTS: Approximately 5 dB,
* ST: Approximately 8 dB.
The trend is generally increasing, with a dip at BB.
* **"BI_C" (Black Triangle):**
* SSN: Approximately 3 dB,
* SAM: Approximately 5 dB,
* BB: Approximately 2 dB,
* AFS: Approximately 8 dB,
* ISTS: Approximately 4 dB,
* ST: Approximately 8 dB.
The trend is relatively flat, with a peak at AFS.
* **"BI_C^AC" (Black Diamond):**
* SSN: Approximately 3 dB,
* SAM: Approximately 5 dB,
* BB: Approximately 2 dB,
* AFS: Approximately 8 dB,
* ISTS: Approximately 8 dB,
* ST: Approximately 9 dB.
The trend is increasing, with a peak at ST.
### Key Observations
* In the SRT50 plot, the "BI_C" and "BI_C^AC" methods generally result in lower (more negative) SRT50 values compared to "data" and "BMFD", especially for ISTS and ST conditions.
* In the SRM plot, the "data" method shows a clear increasing trend from SSN to ST.
* Error bars are present on some data points, indicating variability in the measurements. The error bars are larger for the "data" series in the ST condition for both plots.
### Interpretation
The plots compare the performance of different methods ("data", "BMFD", "BI_C", "BI_C^AC") in terms of SRT50 and SRM across various auditory conditions (SSN, SAM, BB, AFS, ISTS, ST). The SRT50 values indicate the speech reception threshold, with lower values suggesting better performance (i.e., lower intensity needed to understand speech). The SRM values indicate the speech reception masking, with higher values suggesting more masking.
The "BI_C" and "BI_C^AC" methods appear to improve speech reception in the ISTS and ST conditions, as indicated by the lower SRT50 values. However, the SRM values for these methods are not consistently lower than the "data" method, suggesting that the improvement in SRT50 may not be due to reduced masking. The "data" method shows a clear increase in SRM from SSN to ST, indicating that masking becomes more pronounced in the ST condition. The large error bars for the "data" series in the ST condition suggest that the performance of this method is highly variable in this condition.