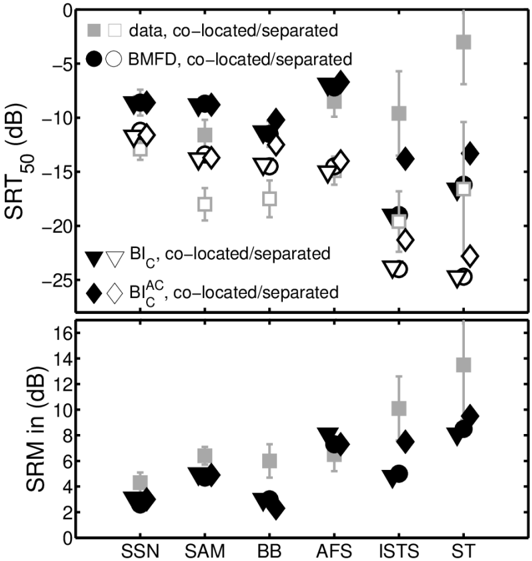
## Chart/Diagram Type: Two-panel comparison of SRT50 and SRM values
### Overview
The image presents two panels comparing acoustic metrics (SRT50 and SRM) across six categories (SSN, SAM, BB, AFS, ISTS, ST). Each panel uses distinct symbols and colors to represent different data series, with error bars indicating measurement uncertainty.
### Components/Axes
- **Top Panel (SRT50 in dB)**:
- **X-axis**: Categories (SSN, SAM, BB, AFS, ISTS, ST)
- **Y-axis**: SRT50 values (dB), ranging from -25 to 0.
- **Legend**:
- Gray squares: "data, co-located/separated"
- Black circles: "BMFD, co-located/separated"
- Black triangles: "BI_C, co-located/separated"
- Black diamonds: "BI_AC, co-located/separated"
- **Data Points**:
- Gray squares (data) and black circles (BMFD) cluster between -10 and -20 dB.
- Black triangles (BI_C) and diamonds (BI_AC) show lower values (-20 to -25 dB).
- **Bottom Panel (SRM in dB)**:
- **X-axis**: Same categories (SSN, SAM, BB, AFS, ISTS, ST).
- **Y-axis**: SRM values (dB), ranging from 0 to 16.
- **Legend**:
- Black circles: "BMFD, co-located/separated"
- Black diamonds: "BI_AC, co-located/separated"
- **Data Points**:
- Black circles (BMFD) increase from ~4 dB (SSN) to ~9 dB (ST).
- Black diamonds (BI_AC) rise from ~3 dB (SSN) to ~8 dB (ST).
### Detailed Analysis
- **Top Panel Trends**:
- **Data (gray squares)**: SRT50 values decrease slightly across categories (e.g., -10 dB for SSN to -15 dB for ISTS).
- **BMFD (black circles)**: Similar trend to data, with minor fluctuations (e.g., -12 dB for SSN to -18 dB for ISTS).
- **BI_C (black triangles)**: Consistently lower than data/BMFD (e.g., -18 dB for SSN to -25 dB for ISTS).
- **BI_AC (black diamonds)**: Lowest values, with a steep decline (e.g., -22 dB for SSN to -28 dB for ISTS).
- **Error Bars**: Largest uncertainties in ISTS and ST (e.g., ±3 dB for ISTS data).
- **Bottom Panel Trends**:
- **BMFD (black circles)**: SRM increases steadily (4 dB → 9 dB).
- **BI_AC (black diamonds)**: Slightly lower than BMFD but follows a similar upward trend (3 dB → 8 dB).
- **Error Bars**: Smaller uncertainties compared to the top panel (e.g., ±1 dB for ISTS).
### Key Observations
1. **BI_AC consistently underperforms** in SRT50 (lower values) but shows higher SRM, suggesting trade-offs in acoustic metrics.
2. **BI_C and data/BMFD** exhibit similar SRT50 trends but diverge in SRM.
3. **Error bars** highlight variability, particularly in ISTS and ST for SRT50.
### Interpretation
The data suggests that **BI_AC** may prioritize SRM over SRT50, potentially indicating a focus on different acoustic properties. The **BI_C** series shows the most significant attenuation (lowest SRT50), while **BMFD** balances both metrics. The error bars imply measurement challenges in certain categories (e.g., ISTS/ST), warranting further investigation. The separation of "co-located/separated" in the legend hints at experimental conditions affecting results, though the exact implications require additional context.