## Bar Chart: Relative Improvement (RI) by Domain
### Overview
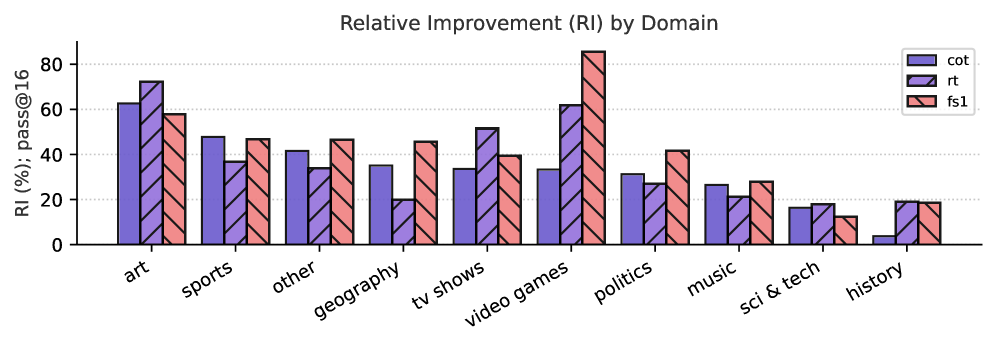
The chart visualizes Relative Improvement (RI) percentages across 11 domains for three data series: "cot" (blue), "rt" (purple), and "fs1" (red). RI is measured as a percentage of "pass@16" performance, with values ranging from 0% to 80% on the y-axis. Domains include art, sports, other, geography, tv shows, video games, politics, music, sci & tech, and history.
### Components/Axes
- **X-axis (Domains)**: Art, sports, other, geography, tv shows, video games, politics, music, sci & tech, history.
- **Y-axis (RI %)**: 0–80% scale with 20% increments.
- **Legend**:
- Blue (cot)
- Purple (rt)
- Red (fs1)
- **Bar Style**: Grouped bars per domain, with diagonal hatching for rt and solid colors for cot/fs1.
### Detailed Analysis
1. **Art**:
- cot: ~60% (blue)
- rt: ~70% (purple)
- fs1: ~55% (red)
2. **Sports**:
- cot: ~45% (blue)
- rt: ~35% (purple)
- fs1: ~45% (red)
3. **Other**:
- cot: ~40% (blue)
- rt: ~30% (purple)
- fs1: ~45% (red)
4. **Geography**:
- cot: ~35% (blue)
- rt: ~20% (purple)
- fs1: ~45% (red)
5. **TV Shows**:
- cot: ~30% (blue)
- rt: ~50% (purple)
- fs1: ~40% (red)
6. **Video Games**:
- cot: ~30% (blue)
- rt: ~60% (purple)
- fs1: ~85% (red)
7. **Politics**:
- cot: ~30% (blue)
- rt: ~25% (purple)
- fs1: ~40% (red)
8. **Music**:
- cot: ~25% (blue)
- rt: ~20% (purple)
- fs1: ~25% (red)
9. **Sci & Tech**:
- cot: ~15% (blue)
- rt: ~15% (purple)
- fs1: ~10% (red)
10. **History**:
- cot: ~5% (blue)
- rt: ~15% (purple)
- fs1: ~15% (red)
### Key Observations
- **fs1 Dominance**: fs1 consistently shows the highest RI in most domains (e.g., video games: 85%, art: 55%).
- **rt Peaks**: rt outperforms others in art (70%) and video games (60%).
- **cot Weakness**: cot has the lowest RI in history (5%) and sci & tech (15%).
- **Anomalies**:
- rt underperforms in geography (20%) and music (20%).
- fs1 drops sharply in sci & tech (10%).
### Interpretation
The data suggests **fs1** is the most effective domain-specific intervention overall, particularly in high-impact areas like video games. **rt** excels in creative domains (art, video games) but struggles in technical fields (geography, sci & tech). **cot** performs poorly in specialized domains (history, sci & tech), indicating potential limitations in adaptability. The stark contrast in fs1’s performance across domains (e.g., 85% in video games vs. 10% in sci & tech) highlights its domain-dependent efficacy. The low RI in sci & tech for all series may reflect inherent challenges in that domain or data collection biases.