\n
## Line Chart: Accuracy vs. Attack Ratio for Federated Learning Methods
### Overview
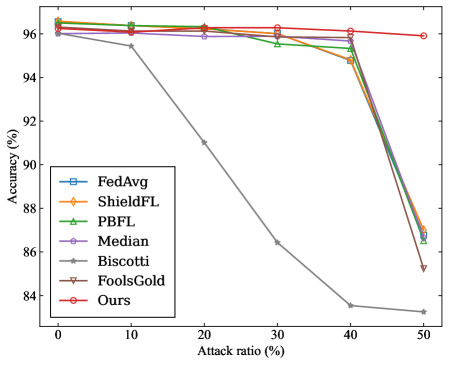
The image is a line chart comparing the performance (accuracy) of seven different federated learning methods or defense mechanisms as the ratio of adversarial attacks increases. The chart demonstrates how each method's accuracy degrades under increasing attack pressure.
### Components/Axes
* **X-Axis:** Labeled "Attack ratio (%)". It represents the percentage of malicious participants or attacks in the system. The axis has major tick marks at 0, 10, 20, 30, 40, and 50.
* **Y-Axis:** Labeled "Accuracy (%)". It represents the model's accuracy. The axis has major tick marks at 84, 86, 88, 90, 92, 94, and 96.
* **Legend:** Located in the bottom-left quadrant of the chart area. It lists seven data series with corresponding line colors and marker symbols:
1. **FedAvg:** Blue line with square markers (□).
2. **ShieldFL:** Orange line with diamond markers (◇).
3. **PBFL:** Green line with upward-pointing triangle markers (△).
4. **Median:** Purple line with circle markers (○).
5. **Biscotti:** Gray line with star/asterisk markers (☆).
6. **FoolsGold:** Brown line with downward-pointing triangle markers (▽).
7. **Ours:** Red line with circle markers (○).
### Detailed Analysis
The chart plots Accuracy (%) against Attack ratio (%). All methods start at a high accuracy (approximately 96%) when the attack ratio is 0%. As the attack ratio increases, the accuracy of most methods declines, but at dramatically different rates.
**Data Series Trends & Approximate Values:**
1. **Ours (Red line, ○):**
* **Trend:** Shows the most robust performance. The line remains nearly flat, exhibiting only a very slight downward slope.
* **Data Points:** ~96.2% (0%), ~96.1% (10%), ~96.1% (20%), ~96.0% (30%), ~95.9% (40%), ~95.8% (50%).
2. **Median (Purple line, ○):**
* **Trend:** Very stable, similar to "Ours" but with a marginally steeper decline at the highest attack ratio.
* **Data Points:** ~96.0% (0%), ~95.9% (10%), ~95.8% (20%), ~95.7% (30%), ~95.6% (40%), ~95.0% (50%).
3. **FedAvg (Blue line, □), ShieldFL (Orange line, ◇), PBFL (Green line, △), FoolsGold (Brown line, ▽):**
* **Trend:** These four methods follow a very similar pattern. They maintain high accuracy (~96%) until an attack ratio of 30-40%, after which they experience a sharp, precipitous drop.
* **Data Points (Approximate for the group):** ~96.0% (0%), ~96.0% (10%), ~95.8% (20%), ~95.5% (30%). At 40%, they begin to diverge slightly: FedAvg/PBFL ~95.0%, ShieldFL ~94.8%, FoolsGold ~94.5%. At 50%, they all drop significantly: FedAvg ~86.5%, PBFL ~87.0%, ShieldFL ~87.0%, FoolsGold ~85.2%.
4. **Biscotti (Gray line, ☆):**
* **Trend:** Exhibits the worst performance and earliest degradation. The line shows a steady, steep downward slope from the beginning.
* **Data Points:** ~96.0% (0%), ~95.5% (10%), ~91.0% (20%), ~86.5% (30%), ~83.5% (40%), ~83.2% (50%).
### Key Observations
1. **Clear Performance Tiers:** The methods cluster into three distinct performance tiers under attack:
* **Tier 1 (Highly Robust):** "Ours" and "Median" maintain accuracy above ~95% even at a 50% attack ratio.
* **Tier 2 (Moderately Robust, then Collapse):** FedAvg, ShieldFL, PBFL, and FoolsGold are resilient up to a ~30-40% attack ratio but fail catastrophically beyond that point.
* **Tier 3 (Vulnerable):** Biscotti's accuracy degrades linearly and significantly with any increase in attack ratio.
2. **Critical Threshold:** For four of the seven methods, an attack ratio between 30% and 40% appears to be a critical failure threshold.
3. **"Ours" is the Top Performer:** The method labeled "Ours" demonstrates the highest and most consistent accuracy across the entire range of attack ratios tested.
### Interpretation
This chart is a robustness evaluation of federated learning aggregation or defense strategies. The "Attack ratio" simulates an increasingly hostile environment where a larger portion of participating devices are malicious (e.g., sending poisoned model updates).
* **What the data suggests:** The proposed method ("Ours") and the "Median" aggregation are significantly more resilient to Byzantine (malicious) attacks than the other compared methods. Their design likely incorporates robust statistics or other mechanisms that are not easily fooled by a high volume of adversarial inputs.
* **How elements relate:** The sharp drop-off for FedAvg, ShieldFL, PBFL, and FoolsGold indicates they have a breaking point. Their defense mechanisms may work well when malicious actors are a minority but become overwhelmed and fail completely when malicious participants approach or exceed 40-50% of the total. Biscotti's linear decline suggests its defense is fundamentally less effective, offering little resistance as attacks increase.
* **Notable Anomaly:** The near-identical performance of FedAvg, ShieldFL, PBFL, and FoolsGold until the 30% mark is striking. It suggests that under moderate attack conditions, these different methods offer similar levels of protection, and their key differentiator is their failure mode under extreme conditions.
* **Practical Implication:** For a real-world federated learning system where security is a concern, choosing an aggregation method from Tier 1 ("Ours" or "Median") would provide a much larger safety margin. Methods from Tier 2 might be acceptable only if the system can guarantee the attack ratio will never approach the 30-40% threshold.