## Line Chart: Accuracy vs. Attack Ratio
### Overview
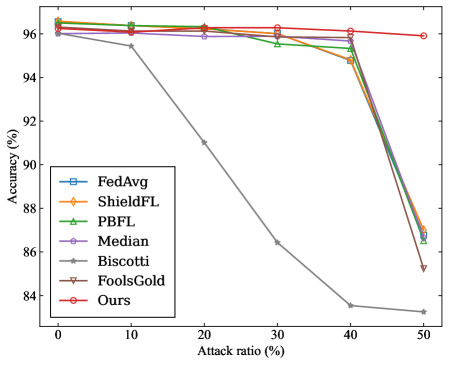
The chart compares the accuracy retention of various machine learning defense mechanisms against adversarial attacks, measured as attack ratio percentage. Accuracy is plotted on the y-axis (84-96%) and attack ratio on the x-axis (0-50%). Seven defense strategies are compared through distinct colored lines with unique markers.
### Components/Axes
- **Y-axis**: Accuracy (%) [84-96], labeled "Accuracy (%)"
- **X-axis**: Attack ratio (%) [0-50], labeled "Attack ratio (%)"
- **Legend**: Located in bottom-left corner, mapping:
- Blue squares: FedAvg
- Orange diamonds: ShieldFL
- Green triangles: PBFL
- Purple diamonds: Median
- Gray stars: Biscotti
- Brown triangles: FoolsGold
- Red circles: Ours
### Detailed Analysis
1. **FedAvg** (blue squares): Starts at ~96.5% accuracy at 0% attack ratio, shows gradual decline to ~95.5% at 50% attack ratio.
2. **ShieldFL** (orange diamonds): Begins at ~96.2%, maintains near-horizontal trajectory until 40% attack ratio, then drops sharply to ~87%.
3. **PBFL** (green triangles): Starts at ~96.3%, shows moderate decline to ~94.5% at 50% attack ratio.
4. **Median** (purple diamonds): Remains relatively flat at ~95.8% across all attack ratios.
5. **Biscotti** (gray stars): Starts at ~96%, shows steep linear decline to ~83.5% at 50% attack ratio.
6. **FoolsGold** (brown triangles): Begins at ~96.1%, maintains stability until 40% attack ratio, then plummets to ~85%.
7. **Ours** (red circles): Maintains highest accuracy throughout, starting at ~96.4% and ending at ~95.8% with minimal decline.
### Key Observations
- **Robustness**: "Ours" demonstrates superior resilience, maintaining >95% accuracy across all attack ratios.
- **Vulnerability**: "Biscotti" and "FoolsGold" exhibit the most severe degradation, dropping >12% accuracy at maximum attack ratio.
- **Stability**: "Median" and "PBFL" show moderate stability, with <2% accuracy loss across the attack spectrum.
- **Threshold Behavior**: "ShieldFL" and "FoolsGold" exhibit threshold-like behavior, maintaining high accuracy until a critical attack ratio (~40%) before rapid decline.
### Interpretation
The data reveals fundamental differences in attack resilience among defense mechanisms. The "Ours" method's consistent performance suggests architectural advantages in adversarial robustness. The sharp declines in "Biscotti" and "FoolsGold" indicate potential single points of failure in their designs. Notably, the "Median" method's stability implies that simple averaging techniques may provide baseline protection against certain attack types. The threshold behavior observed in "ShieldFL" and "FoolsGold" suggests these methods might employ confidence-based filtering mechanisms that become ineffective beyond certain attack intensities. These findings highlight the importance of defense mechanism design in maintaining model utility under adversarial conditions, with "Ours" establishing a new benchmark for attack resilience in this evaluation.