## Line Charts: Llama-3.2 Model Performance
### Overview
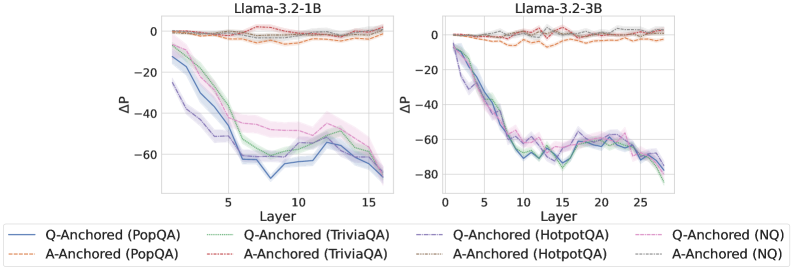
The image contains two line charts comparing the performance of Llama-3.2 models (1B and 3B) on various question-answering tasks. The charts plot the change in performance (ΔP) against the layer number of the model. Different lines represent different question-answering datasets, anchored either by question (Q-Anchored) or answer (A-Anchored).
### Components/Axes
**Left Chart (Llama-3.2-1B):**
* **Title:** Llama-3.2-1B
* **Y-axis:** ΔP (Change in Performance). Scale ranges from approximately -70 to 0. Markers at 0, -20, -40, -60.
* **X-axis:** Layer. Scale ranges from 0 to 15. Markers at 0, 5, 10, 15.
**Right Chart (Llama-3.2-3B):**
* **Title:** Llama-3.2-3B
* **Y-axis:** ΔP (Change in Performance). Scale ranges from approximately -80 to 0. Markers at 0, -20, -40, -60, -80.
* **X-axis:** Layer. Scale ranges from 0 to 25. Markers at 0, 5, 10, 15, 20, 25.
**Legend (Located below the charts):**
* **Q-Anchored (PopQA):** Solid Blue Line
* **A-Anchored (PopQA):** Dashed Orange Line
* **Q-Anchored (TriviaQA):** Dotted Green Line
* **A-Anchored (TriviaQA):** Dashed Pink Line
* **Q-Anchored (HotpotQA):** Dashed-dotted Purple Line
* **A-Anchored (HotpotQA):** Dotted Grey Line
* **Q-Anchored (NQ):** Dashed-dotted Pink Line
* **A-Anchored (NQ):** Dotted Grey Line
### Detailed Analysis
**Llama-3.2-1B Chart:**
* **Q-Anchored (PopQA):** (Solid Blue) Starts at approximately 0, rapidly decreases to around -60 by layer 5, then fluctuates between -60 and -70 until layer 15.
* **A-Anchored (PopQA):** (Dashed Orange) Remains relatively stable around 0 throughout all layers.
* **Q-Anchored (TriviaQA):** (Dotted Green) Starts at approximately 0, decreases to around -50 by layer 5, then fluctuates between -50 and -60 until layer 15.
* **A-Anchored (TriviaQA):** (Dashed Pink) Starts at approximately 0, decreases to around -40 by layer 5, then fluctuates between -40 and -50 until layer 15.
* **Q-Anchored (HotpotQA):** (Dashed-dotted Purple) Starts at approximately 0, decreases to around -50 by layer 5, then fluctuates between -50 and -60 until layer 15.
* **A-Anchored (HotpotQA):** (Dotted Grey) Remains relatively stable around 0 throughout all layers.
* **Q-Anchored (NQ):** (Dashed-dotted Pink) Starts at approximately 0, decreases to around -40 by layer 5, then fluctuates between -40 and -50 until layer 15.
* **A-Anchored (NQ):** (Dotted Grey) Remains relatively stable around 0 throughout all layers.
**Llama-3.2-3B Chart:**
* **Q-Anchored (PopQA):** (Solid Blue) Starts at approximately 0, rapidly decreases to around -70 by layer 5, then fluctuates between -60 and -80 until layer 25.
* **A-Anchored (PopQA):** (Dashed Orange) Remains relatively stable around 0 throughout all layers.
* **Q-Anchored (TriviaQA):** (Dotted Green) Starts at approximately 0, decreases to around -60 by layer 5, then fluctuates between -60 and -80 until layer 25.
* **A-Anchored (TriviaQA):** (Dashed Pink) Starts at approximately 0, decreases to around -60 by layer 5, then fluctuates between -60 and -70 until layer 25.
* **Q-Anchored (HotpotQA):** (Dashed-dotted Purple) Starts at approximately 0, decreases to around -60 by layer 5, then fluctuates between -60 and -80 until layer 25.
* **A-Anchored (HotpotQA):** (Dotted Grey) Remains relatively stable around 0 throughout all layers.
* **Q-Anchored (NQ):** (Dashed-dotted Pink) Starts at approximately 0, decreases to around -60 by layer 5, then fluctuates between -60 and -70 until layer 25.
* **A-Anchored (NQ):** (Dotted Grey) Remains relatively stable around 0 throughout all layers.
### Key Observations
* **Q-Anchored vs. A-Anchored:** Q-Anchored lines show a significant decrease in performance (negative ΔP) as the layer number increases, while A-Anchored lines remain relatively stable around 0.
* **Model Size:** The 3B model generally shows a slightly larger decrease in performance for Q-Anchored tasks compared to the 1B model.
* **Task Variation:** The specific question-answering task (PopQA, TriviaQA, HotpotQA, NQ) influences the magnitude of the performance decrease for Q-Anchored lines.
* **Layer Dependence:** The performance decrease for Q-Anchored tasks is most pronounced in the initial layers (up to layer 5), after which the performance fluctuates.
### Interpretation
The data suggests that anchoring the model by question (Q-Anchored) leads to a degradation in performance as the model processes deeper layers. This could indicate that the model struggles to maintain relevant information from the question as it progresses through the network. In contrast, anchoring by answer (A-Anchored) results in stable performance, suggesting that the model is better at retaining information related to the answer.
The larger performance decrease in the 3B model for Q-Anchored tasks might indicate that larger models are more susceptible to this degradation effect. The variation in performance decrease across different question-answering tasks suggests that the complexity or nature of the task influences the model's ability to retain question-related information.
The initial rapid decrease in performance followed by fluctuations suggests that the early layers of the model are critical for retaining question-related information, and that subsequent layers may not be able to fully compensate for any loss of information in the initial layers.