\n
## Line Chart: ΔP vs. Layer for Llama Models
### Overview
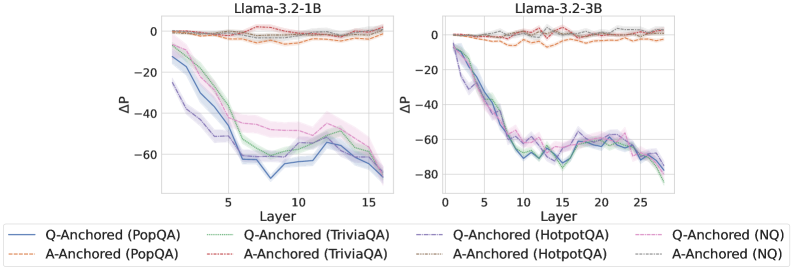
The image presents two line charts, side-by-side, depicting the change in performance (ΔP) as a function of layer depth in two different Llama language models: Llama-3.2-1B and Llama-3.2-3B. Each chart displays multiple lines representing different question-answering datasets and anchoring methods. The charts aim to visualize how performance changes across layers for each model and dataset combination.
### Components/Axes
* **X-axis:** Layer (ranging from approximately 0 to 15 for the 1B model and 0 to 25 for the 3B model). The axis is labeled "Layer".
* **Y-axis:** ΔP (ranging from approximately -80 to 0). The axis is labeled "ΔP".
* **Chart Titles:**
* Left Chart: "Llama-3.2-1B"
* Right Chart: "Llama-3.2-3B"
* **Legend:** Located at the bottom of the image, spanning both charts. The legend identifies the different lines based on dataset and anchoring method.
* Q-Anchored (PopQA) - Blue solid line
* A-Anchored (PopQA) - Orange dashed line
* Q-Anchored (TriviaQA) - Blue dashed-dotted line
* A-Anchored (TriviaQA) - Orange dashed-dotted line
* Q-Anchored (HotpotQA) - Purple dashed line
* A-Anchored (HotpotQA) - Purple dotted line
* Q-Anchored (NQ) - Green solid line
* A-Anchored (NQ) - Green dashed line
### Detailed Analysis or Content Details
**Llama-3.2-1B Chart (Left)**
* **Q-Anchored (PopQA):** Starts at approximately 0 ΔP at Layer 0, rapidly decreases to approximately -60 ΔP by Layer 5, and then plateaus around -60 ΔP for layers 5-15.
* **A-Anchored (PopQA):** Starts at approximately 0 ΔP at Layer 0, decreases to approximately -40 ΔP by Layer 5, and then plateaus around -40 ΔP for layers 5-15.
* **Q-Anchored (TriviaQA):** Starts at approximately 0 ΔP at Layer 0, decreases to approximately -50 ΔP by Layer 5, and then plateaus around -50 ΔP for layers 5-15.
* **A-Anchored (TriviaQA):** Starts at approximately 0 ΔP at Layer 0, decreases to approximately -30 ΔP by Layer 5, and then plateaus around -30 ΔP for layers 5-15.
* **Q-Anchored (HotpotQA):** Starts at approximately 0 ΔP at Layer 0, decreases to approximately -40 ΔP by Layer 5, and then plateaus around -40 ΔP for layers 5-15.
* **A-Anchored (HotpotQA):** Starts at approximately 0 ΔP at Layer 0, decreases to approximately -20 ΔP by Layer 5, and then plateaus around -20 ΔP for layers 5-15.
* **Q-Anchored (NQ):** Starts at approximately 0 ΔP at Layer 0, decreases to approximately -50 ΔP by Layer 5, and then plateaus around -50 ΔP for layers 5-15.
* **A-Anchored (NQ):** Starts at approximately 0 ΔP at Layer 0, decreases to approximately -30 ΔP by Layer 5, and then plateaus around -30 ΔP for layers 5-15.
**Llama-3.2-3B Chart (Right)**
* **Q-Anchored (PopQA):** Starts at approximately 0 ΔP at Layer 0, rapidly decreases to approximately -60 ΔP by Layer 5, and then continues to decrease, reaching approximately -80 ΔP by Layer 25.
* **A-Anchored (PopQA):** Starts at approximately 0 ΔP at Layer 0, decreases to approximately -40 ΔP by Layer 5, and then continues to decrease, reaching approximately -60 ΔP by Layer 25.
* **Q-Anchored (TriviaQA):** Starts at approximately 0 ΔP at Layer 0, decreases to approximately -50 ΔP by Layer 5, and then continues to decrease, reaching approximately -70 ΔP by Layer 25.
* **A-Anchored (TriviaQA):** Starts at approximately 0 ΔP at Layer 0, decreases to approximately -30 ΔP by Layer 5, and then continues to decrease, reaching approximately -50 ΔP by Layer 25.
* **Q-Anchored (HotpotQA):** Starts at approximately 0 ΔP at Layer 0, decreases to approximately -40 ΔP by Layer 5, and then continues to decrease, reaching approximately -60 ΔP by Layer 25.
* **A-Anchored (HotpotQA):** Starts at approximately 0 ΔP at Layer 0, decreases to approximately -20 ΔP by Layer 5, and then continues to decrease, reaching approximately -40 ΔP by Layer 25.
* **Q-Anchored (NQ):** Starts at approximately 0 ΔP at Layer 0, decreases to approximately -50 ΔP by Layer 5, and then continues to decrease, reaching approximately -70 ΔP by Layer 25.
* **A-Anchored (NQ):** Starts at approximately 0 ΔP at Layer 0, decreases to approximately -30 ΔP by Layer 5, and then continues to decrease, reaching approximately -50 ΔP by Layer 25.
### Key Observations
* In both models, all lines exhibit a decreasing trend in ΔP as the layer depth increases, indicating a performance degradation with deeper layers.
* The 3B model shows a more pronounced and continuous decrease in ΔP across all datasets and anchoring methods compared to the 1B model.
* Q-Anchored lines generally have lower ΔP values than A-Anchored lines for the same dataset, suggesting that question-anchoring leads to a greater performance drop with increasing layer depth.
* The performance drop appears to stabilize after a certain layer depth in the 1B model, while it continues to decrease in the 3B model.
### Interpretation
The charts demonstrate that increasing the depth of the Llama models (moving to deeper layers) generally leads to a decrease in performance, as measured by ΔP. This suggests that the later layers may not be contributing positively to the model's ability to answer questions accurately. The more significant performance drop in the 3B model could indicate that deeper models are more susceptible to issues like overfitting or vanishing gradients.
The difference between Q-Anchored and A-Anchored lines suggests that the method used to anchor the questions affects how performance degrades with depth. Question-anchoring might be more sensitive to the complexities introduced by deeper layers.
The stabilization of performance in the 1B model after a certain layer depth could be due to the model's limited capacity. Once the model reaches its capacity, adding more layers does not necessarily lead to further performance degradation. The continued decrease in the 3B model suggests that it has not yet reached its capacity and that deeper layers are still actively contributing to the performance drop.
These findings have implications for model architecture design and training strategies. It may be beneficial to explore techniques to mitigate performance degradation in deeper layers, such as regularization or layer pruning.