## Line Graph: ΔP vs. Layer for Llama-3.2-1B and Llama-3.2-3B Models
### Overview
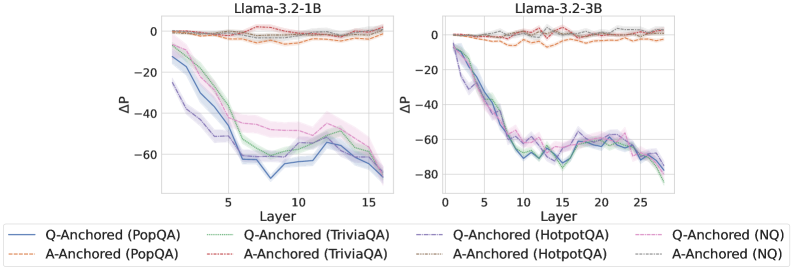
The image contains two line graphs comparing the performance (ΔP) of different Q-Anchored and A-Anchored models across layers in two versions of the Llama model (3.2-1B and 3.2-3B). The graphs show trends in ΔP values as a function of layer depth, with distinct lines representing different datasets (PopQA, TriviaQA, HotpotQA, NQ) and anchoring strategies (Q-Anchored vs. A-Anchored).
---
### Components/Axes
- **X-axis (Layer)**: Represents the depth of the model layers, ranging from 0 to 15 for Llama-3.2-1B and 0 to 25 for Llama-3.2-3B.
- **Y-axis (ΔP)**: Represents the performance metric (ΔP), with values ranging from -80 to 0.
- **Legends**:
- **Llama-3.2-1B (Left Graph)**:
- **Blue Solid**: Q-Anchored (PopQA)
- **Green Dashed**: Q-Anchored (TriviaQA)
- **Orange Dotted**: A-Anchored (PopQA)
- **Red Dashed**: A-Anchored (TriviaQA)
- **Purple Dotted**: Q-Anchored (HotpotQA)
- **Pink Dashed**: Q-Anchored (NQ)
- **Llama-3.2-3B (Right Graph)**:
- **Blue Solid**: Q-Anchored (PopQA)
- **Green Dashed**: Q-Anchored (TriviaQA)
- **Orange Dotted**: A-Anchored (PopQA)
- **Red Dashed**: A-Anchored (TriviaQA)
- **Purple Dotted**: Q-Anchored (HotpotQA)
- **Pink Dashed**: Q-Anchored (NQ)
---
### Detailed Analysis
#### Llama-3.2-1B (Left Graph)
- **Q-Anchored (PopQA)**: Starts at 0, drops sharply to ~-60 by layer 5, then stabilizes with minor fluctuations.
- **Q-Anchored (TriviaQA)**: Similar to PopQA but with a slightly less steep decline, reaching ~-50 by layer 5.
- **A-Anchored (PopQA)**: Starts at 0, declines to ~-40 by layer 5, then stabilizes.
- **A-Anchored (TriviaQA)**: Similar to A-Anchored (PopQA) but with a slightly less steep decline.
- **Q-Anchored (HotpotQA)**: Starts at 0, drops to ~-50 by layer 5, then stabilizes.
- **Q-Anchored (NQ)**: Remains flat at 0 across all layers.
#### Llama-3.2-3B (Right Graph)
- **Q-Anchored (PopQA)**: Starts at 0, drops sharply to ~-70 by layer 5, then stabilizes with minor fluctuations.
- **Q-Anchored (TriviaQA)**: Similar to PopQA but with a slightly less steep decline, reaching ~-60 by layer 5.
- **A-Anchored (PopQA)**: Starts at 0, declines to ~-50 by layer 5, then stabilizes.
- **A-Anchored (TriviaQA)**: Similar to A-Anchored (PopQA) but with a slightly less steep decline.
- **Q-Anchored (HotpotQA)**: Starts at 0, drops to ~-60 by layer 5, then stabilizes.
- **Q-Anchored (NQ)**: Remains flat at 0 across all layers.
---
### Key Observations
1. **Initial Sharp Decline**: All Q-Anchored models (PopQA, TriviaQA, HotpotQA) show a sharp drop in ΔP within the first 5 layers, followed by stabilization.
2. **A-Anchored Models**: Show similar trends but with less pronounced declines and more gradual stabilization.
3. **NQ Models**: Remain flat at 0, indicating no significant change in ΔP across layers.
4. **Layer Depth**: The 3B version (right graph) extends to 25 layers, showing consistent trends but with more variability in later layers (e.g., oscillations in Q-Anchored (HotpotQA) around layer 20).
---
### Interpretation
- **Model Behavior**: The sharp initial decline in ΔP for Q-Anchored models suggests a strong initial impact of anchoring strategies, which diminishes as layers deepen. This could indicate that anchoring effects are most pronounced in early layers.
- **Dataset Differences**: PopQA and TriviaQA show similar trends, while HotpotQA exhibits slightly more variability, possibly due to differences in data complexity or model sensitivity.
- **Anchoring Strategy**: Q-Anchored models consistently outperform A-Anchored models in terms of ΔP magnitude, suggesting that Q-Anchored strategies are more effective in this context.
- **NQ Models**: The flat line for NQ models implies that non-anchored approaches do not show significant layer-dependent performance changes, highlighting the importance of anchoring in this analysis.
---
### Spatial Grounding
- **Legends**: Positioned at the bottom of each graph, with labels aligned to the left. Colors and line styles match the corresponding data series.
- **Axes**: ΔP (y-axis) is on the left, Layer (x-axis) is at the bottom. Both axes are labeled clearly.
- **Data Series**: Lines are plotted with distinct styles (solid, dashed, dotted) and colors (blue, green, orange, red, purple, pink) as per the legend.
---
### Uncertainties
- Approximate ΔP values are estimated from the graph (e.g., ~-60, ~-50) due to the lack of explicit numerical markers. Minor fluctuations in later layers (e.g., Llama-3.2-3B) may introduce slight variability in trend interpretation.