## Scatter Plot: Principal Component Analysis of "deeper"
### Overview
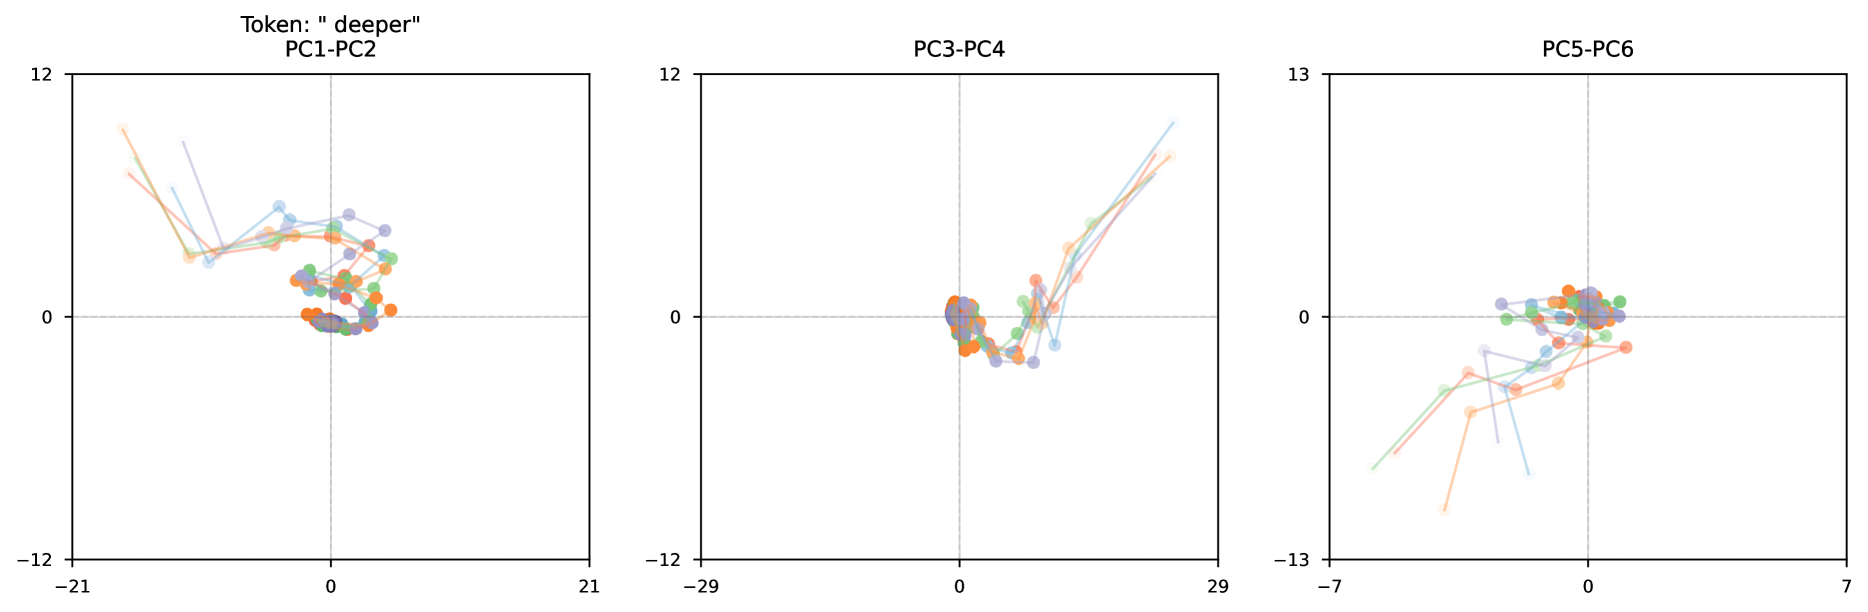
The image presents three scatter plots, each displaying the relationship between two principal components (PCs) derived from an unspecified dataset. The plots are labeled PC1-PC2, PC3-PC4, and PC5-PC6. Each plot shows multiple trajectories, represented by lines connecting data points, with each trajectory likely representing a different instance or condition. The token being analyzed is "deeper".
### Components/Axes
* **Titles:**
* Top-left: "Token: " deeper""
* Top-middle: PC3-PC4
* Top-right: PC5-PC6
* Top-center: PC1-PC2
* **Axes:** Each plot has an x and y axis.
* **PC1-PC2 Plot:**
* X-axis: Ranges from -21 to 21, with a center at 0.
* Y-axis: Ranges from -12 to 12, with a center at 0.
* **PC3-PC4 Plot:**
* X-axis: Ranges from -29 to 29, with a center at 0.
* Y-axis: Ranges from -12 to 12, with a center at 0.
* **PC5-PC6 Plot:**
* X-axis: Ranges from -7 to 7, with a center at 0.
* Y-axis: Ranges from -13 to 13, with a center at 0.
* **Gridlines:** Each plot has gridlines at x=0 and y=0.
* **Data Points:** Each trajectory consists of multiple data points connected by lines. The data points are colored in shades of blue, orange, green, and light blue. There is no explicit legend.
### Detailed Analysis
* **PC1-PC2 Plot:**
* The trajectories start from various points in the upper-left quadrant and converge towards the center (around 0,0).
* The data points cluster around the origin.
* **PC3-PC4 Plot:**
* The trajectories start near the origin and move towards the upper-right quadrant.
* The data points are more spread out compared to the PC1-PC2 plot.
* **PC5-PC6 Plot:**
* The trajectories start from various points and converge towards the center (around 0,0).
* The data points cluster around the origin, similar to the PC1-PC2 plot.
### Key Observations
* The PC1-PC2 and PC5-PC6 plots show a convergence of trajectories towards the origin, suggesting that these principal components may be less variable or less informative for distinguishing between the different instances or conditions represented by the trajectories.
* The PC3-PC4 plot shows trajectories moving away from the origin, indicating that these principal components may be more variable and more informative.
* The trajectories in each plot appear to represent different instances or conditions, as they follow distinct paths.
### Interpretation
The plots visualize the behavior of the word "deeper" in a high-dimensional space reduced to its principal components. The convergence towards the origin in the PC1-PC2 and PC5-PC6 plots suggests that the variance along these components is relatively low, meaning that the different instances of "deeper" are similar in these dimensions. Conversely, the divergence in the PC3-PC4 plot indicates higher variance, suggesting that the instances of "deeper" differ more significantly along these components. This analysis could be used to understand which aspects of the word's usage (represented by the original high-dimensional data) are most variable and therefore potentially most important for distinguishing between different contexts or meanings. The absence of a legend makes it difficult to determine what each trajectory represents (e.g., different speakers, different contexts, etc.).