## Line Graphs: Qwen2.5-7B and Llama3.1-8B Performance Comparison
### Overview
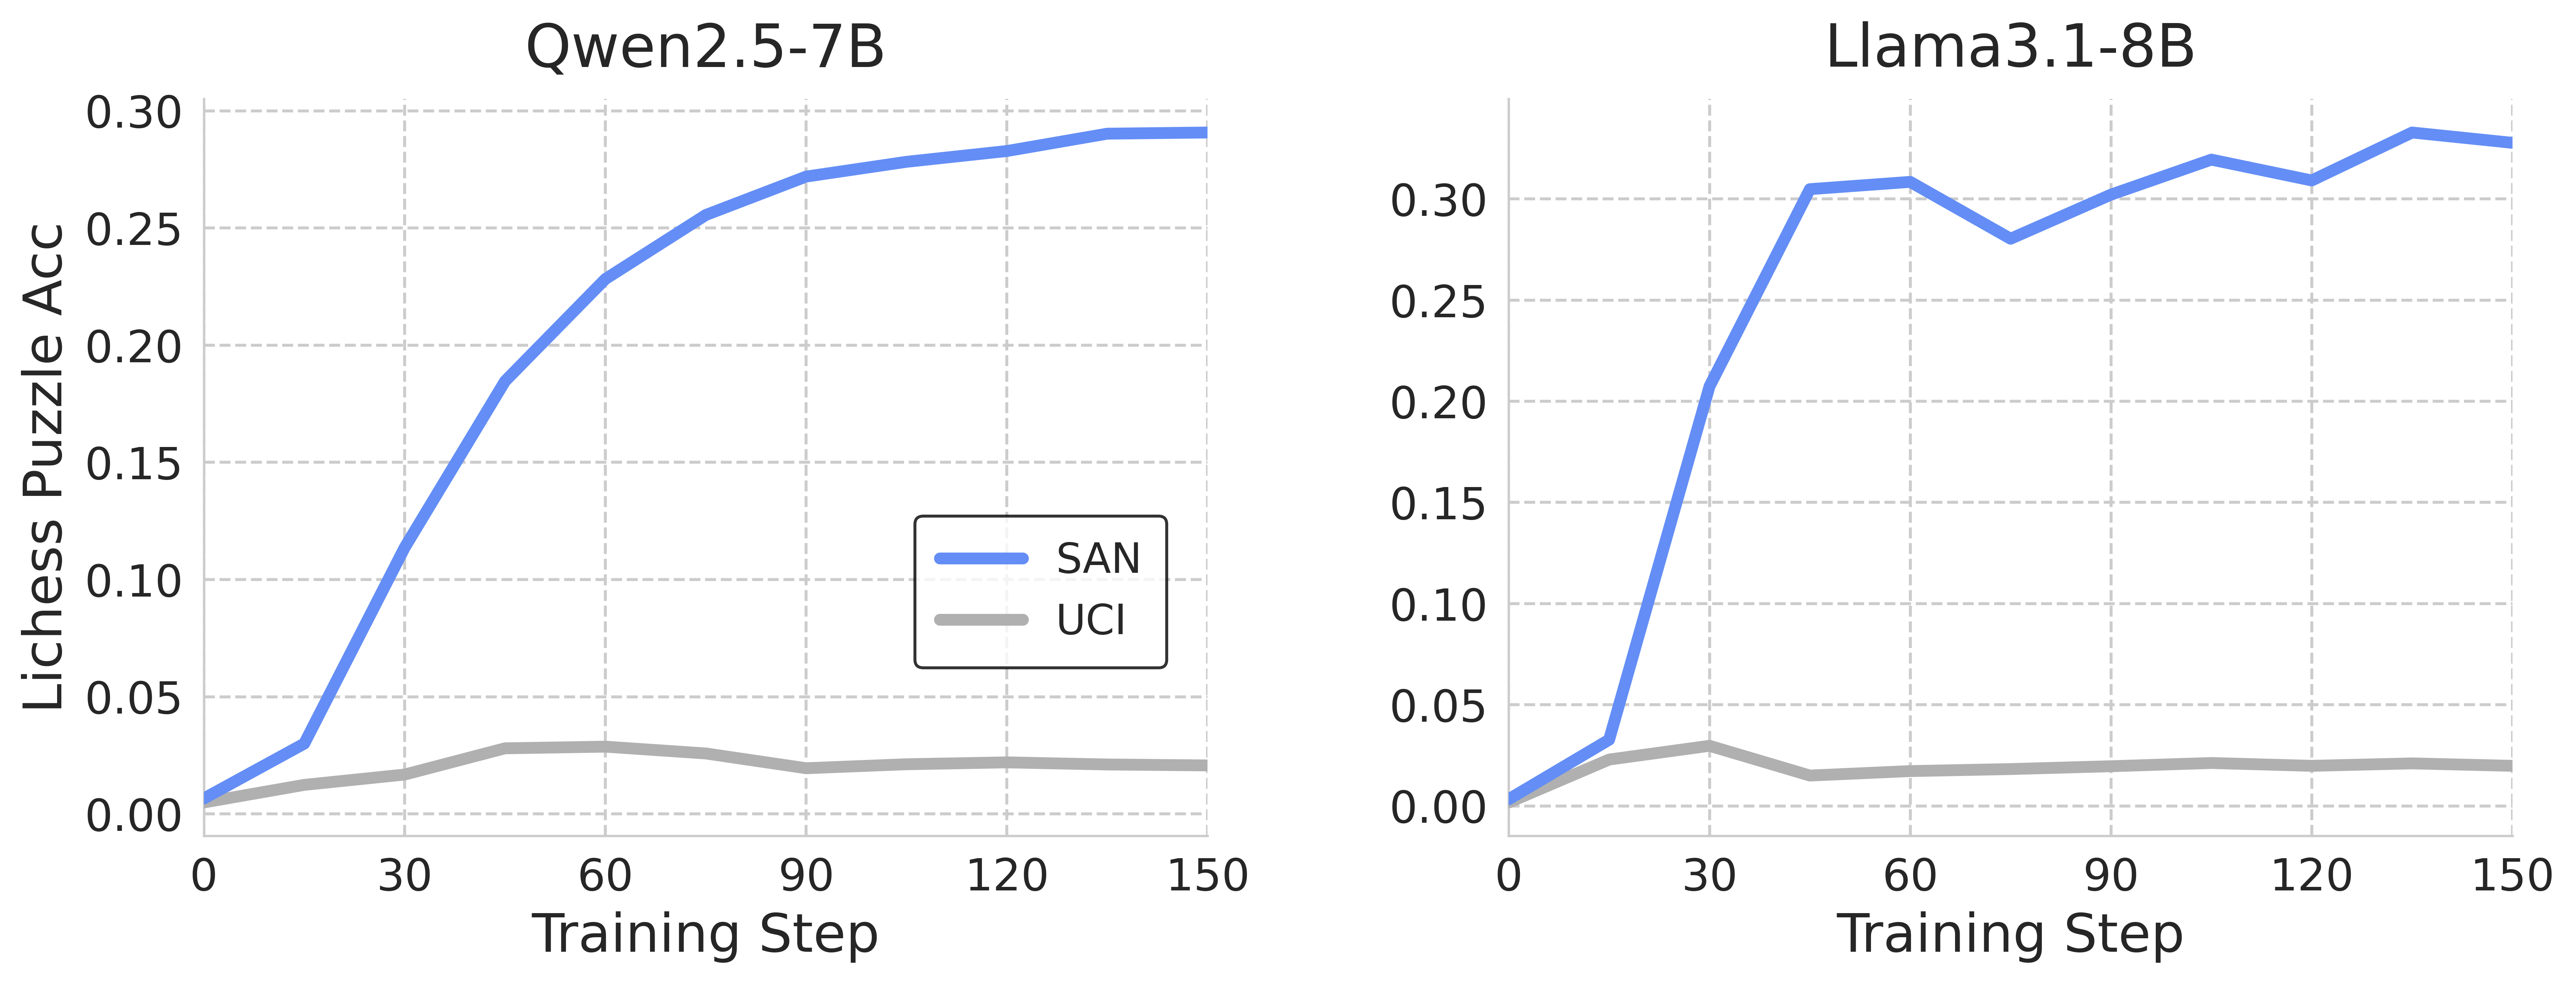
The image contains two side-by-side line graphs comparing the performance of two AI models (Qwen2.5-7B and Llama3.1-8B) across training steps. Each graph tracks two metrics: "SAN" (blue line) and "UCI" (gray line), measured as "Lichess Puzzle Acc" (accuracy) on a scale from 0.00 to 0.30. Training steps range from 0 to 150 on the x-axis.
---
### Components/Axes
- **Left Graph (Qwen2.5-7B)**:
- **Title**: "Qwen2.5-7B"
- **X-axis**: "Training Step" (0–150, increments of 30)
- **Y-axis**: "Lichess Puzzle Acc" (0.00–0.30, increments of 0.05)
- **Legend**: Located in the bottom-right corner, labeled "SAN" (blue) and "UCI" (gray).
- **Lines**:
- **Blue (SAN)**: Starts near 0.01, rises sharply to ~0.29 by step 150.
- **Gray (UCI)**: Starts near 0.005, peaks at ~0.03 around step 40, then declines to ~0.02.
- **Right Graph (Llama3.1-8B)**:
- **Title**: "Llama3.1-8B"
- **X-axis**: "Training Step" (0–150, increments of 30)
- **Y-axis**: "Lichess Puzzle Acc" (0.00–0.30, increments of 0.05)
- **Legend**: Located in the bottom-right corner, labeled "SAN" (blue) and "UCI" (gray).
- **Lines**:
- **Blue (SAN)**: Starts near 0.01, rises sharply to ~0.30 by step 60, fluctuates between 0.28–0.30 by step 150.
- **Gray (UCI)**: Starts near 0.005, peaks at ~0.025 around step 20, then declines to ~0.015.
---
### Detailed Analysis
#### Qwen2.5-7B
- **SAN (Blue)**:
- Initial value: ~0.01 at step 0.
- Rapid increase to ~0.25 by step 60.
- Gradual plateau to ~0.29 by step 150.
- **UCI (Gray)**:
- Initial value: ~0.005 at step 0.
- Peaks at ~0.03 around step 40.
- Declines to ~0.02 by step 150.
#### Llama3.1-8B
- **SAN (Blue)**:
- Initial value: ~0.01 at step 0.
- Sharp rise to ~0.25 by step 30.
- Peaks at ~0.30 by step 60.
- Fluctuates between 0.28–0.30 by step 150.
- **UCI (Gray)**:
- Initial value: ~0.005 at step 0.
- Peaks at ~0.025 around step 20.
- Declines to ~0.015 by step 150.
---
### Key Observations
1. **SAN Performance**:
- Both models show a steep initial improvement in SAN accuracy, but Llama3.1-8B achieves a higher peak (~0.30 vs. ~0.29).
- Qwen2.5-7B’s SAN plateaus earlier (~step 60), while Llama3.1-8B’s SAN remains volatile after step 60.
2. **UCI Performance**:
- UCI accuracy peaks early in both models (~step 20–40) and declines sharply afterward.
- Llama3.1-8B’s UCI peak is higher (~0.025 vs. ~0.03), but its decline is more pronounced.
3. **Model Comparison**:
- Llama3.1-8B outperforms Qwen2.5-7B in SAN accuracy, suggesting better scalability or efficiency.
- Both models’ UCI metrics indicate potential overfitting or inefficiency in later training stages.
---
### Interpretation
- **SAN Trends**: The sharp rise in SAN accuracy for both models suggests effective learning in early training steps. Llama3.1-8B’s higher peak implies superior performance, possibly due to its larger parameter count (8B vs. 7B). The plateau in Qwen2.5-7B may reflect a learning limit, while Llama3.1-8B’s fluctuations could indicate instability or adaptation to complex patterns.
- **UCI Trends**: The early peak and subsequent decline in UCI accuracy for both models suggest that UCI metrics may measure short-term gains or overfitting. The steeper decline in Llama3.1-8B’s UCI could indicate greater sensitivity to training noise or complexity.
- **Model Differences**: Llama3.1-8B’s larger size correlates with higher SAN performance but also greater volatility, highlighting trade-offs between scale and stability. Qwen2.5-7B’s smoother plateau might indicate more robust training dynamics.
---
### Spatial Grounding
- **Legends**: Both legends are positioned in the bottom-right corner of their respective graphs, ensuring clarity without obstructing data.
- **Line Colors**: Blue (SAN) and gray (UCI) are consistently used across both graphs, avoiding confusion.
### Content Details
- **Qwen2.5-7B SAN**: 0.01 → 0.25 (step 60) → 0.29 (step 150).
- **Qwen2.5-7B UCI**: 0.005 → 0.03 (step 40) → 0.02 (step 150).
- **Llama3.1-8B SAN**: 0.01 → 0.25 (step 30) → 0.30 (step 60) → 0.28–0.30 (step 150).
- **Llama3.1-8B UCI**: 0.005 → 0.025 (step 20) → 0.015 (step 150).
---
### Final Notes
The graphs emphasize the importance of training step efficiency and model architecture in achieving high puzzle-solving accuracy. Llama3.1-8B’s superior SAN performance suggests it may be better suited for tasks requiring rapid learning, while Qwen2.5-7B’s stability could be advantageous in scenarios prioritizing consistency.