## Line Chart: Reward/Overall
### Overview
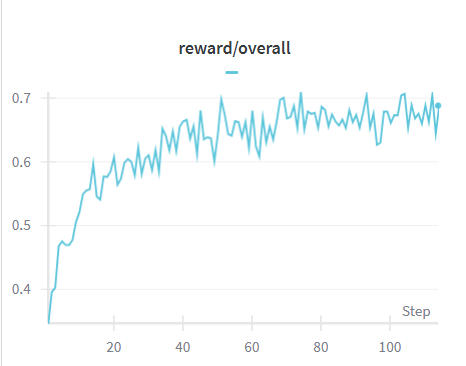
The image is a line chart displaying the "reward/overall" value over a series of steps. The chart shows an initial increase in reward, followed by a period of stabilization with fluctuations.
### Components/Axes
* **Title:** reward/overall
* **X-axis:** Step
* Axis markers at approximately: 20, 40, 60, 80, 100
* **Y-axis:** Reward Value
* Axis markers at: 0.4, 0.5, 0.6, 0.7
* **Data Series:**
* A single light blue line representing the reward/overall value.
### Detailed Analysis
* **Light Blue Line (reward/overall):**
* The line starts at approximately 0.35 at step 0.
* The line increases rapidly to approximately 0.6 around step 20.
* The line fluctuates between approximately 0.6 and 0.7 from step 20 to step 110.
* The line ends at approximately 0.69 at step 110.
### Key Observations
* The reward increases sharply in the initial steps.
* The reward stabilizes after approximately 20 steps, with minor fluctuations.
* There are no significant outliers.
### Interpretation
The chart suggests that the system or model being evaluated experiences a rapid learning phase initially, as indicated by the sharp increase in reward. After this initial phase, the learning plateaus, and the reward fluctuates around a stable value. This could indicate that the system has reached a point of diminishing returns, where further training yields only marginal improvements. The fluctuations could be due to the inherent variability in the environment or the learning process.