\n
## Line Chart: Reward Over Time
### Overview
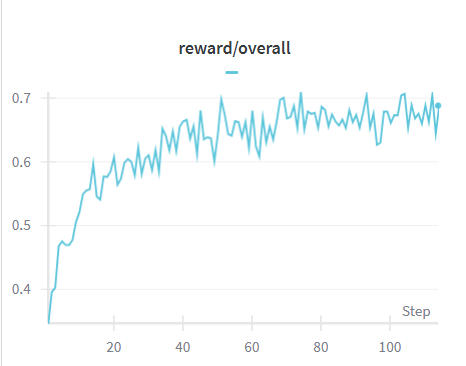
The image displays a line chart illustrating the 'reward/overall' metric over 'Step'. The chart shows a generally increasing trend with fluctuations, indicating a learning or optimization process where the reward improves over time, but not monotonically.
### Components/Axes
* **Title:** reward/overall
* **X-axis:** Step (ranging from approximately 0 to 100)
* **Y-axis:** Reward (ranging from approximately 0.4 to 0.7)
* **Data Series:** A single teal-colored line representing the 'reward/overall' value.
### Detailed Analysis
The line representing 'reward/overall' starts at approximately 0.4 at Step 0. It exhibits a steep upward slope until around Step 10, reaching a value of approximately 0.55. From Step 10 to Step 40, the line fluctuates, generally trending upwards, reaching a peak of around 0.68 at Step 30. Between Step 40 and Step 60, the line experiences more pronounced fluctuations, oscillating between approximately 0.65 and 0.72. From Step 60 to Step 100, the line continues to fluctuate, with a slight downward trend, ending at approximately 0.69 at Step 100.
Here's a breakdown of approximate data points:
* Step 0: Reward ≈ 0.4
* Step 10: Reward ≈ 0.55
* Step 20: Reward ≈ 0.62
* Step 30: Reward ≈ 0.68
* Step 40: Reward ≈ 0.66
* Step 50: Reward ≈ 0.70
* Step 60: Reward ≈ 0.65
* Step 70: Reward ≈ 0.71
* Step 80: Reward ≈ 0.67
* Step 90: Reward ≈ 0.69
* Step 100: Reward ≈ 0.69
### Key Observations
* The reward initially increases rapidly, suggesting quick learning or adaptation.
* The fluctuations after Step 10 indicate a more complex learning process, potentially encountering challenges or exploring different strategies.
* The overall trend is positive, indicating that the system is generally improving its reward over time.
* There is a slight plateau or even a minor decrease in reward towards the end of the observed steps (between 80 and 100).
### Interpretation
The chart likely represents the performance of a reinforcement learning agent or an optimization algorithm. The 'Step' axis represents the iteration or time step, and the 'reward/overall' axis represents the cumulative reward obtained by the agent. The initial rapid increase suggests that the agent quickly learns the basic principles of the environment. The subsequent fluctuations indicate that the agent is exploring more complex strategies or encountering more challenging scenarios. The slight decrease in reward towards the end could indicate that the agent has reached a local optimum or is experiencing diminishing returns. Further investigation would be needed to determine the cause of this plateau and whether further optimization is possible. The data suggests a successful learning process, but with potential for further improvement.