## Line Chart: reward/overall
### Overview
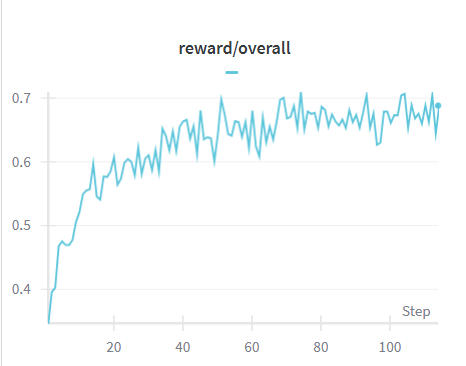
The image is a line chart titled "reward/overall" depicting the relationship between "Step" (x-axis) and "reward/overall" (y-axis). The chart shows a fluctuating trend with a general upward trajectory followed by stabilization. The line is blue, and the legend is positioned at the top of the chart.
### Components/Axes
- **Title**: "reward/overall" (centered at the top).
- **X-axis**: Labeled "Step" with numerical markers at 0, 20, 40, 60, 80, and 100. The scale is linear, with increments of 20.
- **Y-axis**: Labeled "reward/overall" with numerical markers at 0.3, 0.4, 0.5, 0.6, and 0.7. The scale is linear, with increments of 0.1.
- **Legend**: Located at the top of the chart, labeled "reward/overall" with a blue line symbol.
- **Line**: A single blue line representing the "reward/overall" metric, plotted across the x-axis.
### Detailed Analysis
- **Initial Trend (Steps 0–40)**: The line starts at approximately 0.35 (y-axis) and rises steadily, reaching around 0.6 by Step 40. The slope is relatively smooth but shows minor fluctuations.
- **Mid-Range Trend (Steps 40–80)**: The line continues to increase, peaking at approximately 0.65–0.7 between Steps 60 and 80. Fluctuations become more pronounced, with peaks and troughs within this range.
- **Stabilization (Steps 80–100)**: After Step 80, the line stabilizes, fluctuating between 0.65 and 0.7. The amplitude of fluctuations decreases slightly, indicating reduced variability.
### Key Observations
- The line exhibits a **general upward trend** from Step 0 to Step 80, followed by **stabilization**.
- **Peaks** occur around Steps 60–80, with values reaching up to ~0.7.
- **Troughs** are observed around Steps 20–40 and 60–80, with values dipping to ~0.5–0.6.
- The **final value** at Step 100 is approximately 0.68–0.7, slightly lower than the peak but within the stabilized range.
### Interpretation
The chart suggests that the "reward/overall" metric improves significantly over the first 80 steps, likely indicating a learning or optimization phase. The stabilization after Step 80 implies that the system reaches a plateau, where further improvements are minimal. The fluctuations throughout the chart may reflect variability in the data collection process, external factors, or inherent noise in the metric. The absence of a clear downward trend after the peak suggests that the system maintains its performance without significant degradation. The legend and axis labels are consistent, confirming the accuracy of the data representation.