## Chart: ReLU vs Tanh
### Overview
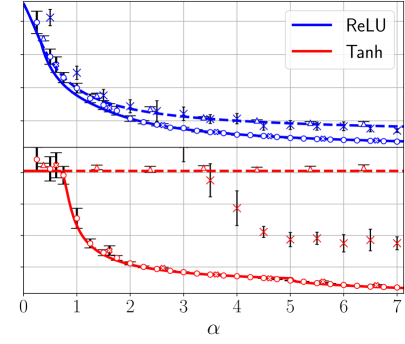
The image is a chart comparing the performance of ReLU and Tanh activation functions. The x-axis represents a variable denoted as "α", ranging from 0 to 7. Two data series are plotted: ReLU (blue) and Tanh (red). Both series have a solid line representing one type of data and a dashed line representing another. Error bars are present on some data points.
### Components/Axes
* **X-axis:** α, ranging from 0 to 7.
* **Y-axis:** (Implicit) Performance metric, not explicitly labeled.
* **Legend (Top-Right):**
* ReLU (blue)
* Tanh (red)
### Detailed Analysis
* **ReLU (Blue):**
* **Solid Line:** Starts at approximately 1.2 at α=0, decreases rapidly to approximately 0.4 at α=2, and then gradually decreases to approximately 0.25 at α=7. The data points are marked with circles.
* **Dashed Line:** Starts at approximately 1.1 at α=0, decreases rapidly to approximately 0.5 at α=2, and then gradually decreases to approximately 0.3 at α=7. The data points are marked with asterisks.
* **Tanh (Red):**
* **Solid Line:** Starts at approximately 0.8 at α=0, decreases rapidly to approximately 0.1 at α=2, and then gradually decreases to approximately 0.02 at α=7. The data points are marked with circles.
* **Dashed Line:** Starts at approximately 0.8 at α=0, remains relatively constant at approximately 0.75 until α=3, and then has some error bars at α=4. The data points are marked with asterisks.
### Key Observations
* The solid lines for both ReLU and Tanh show a decreasing trend as α increases.
* The dashed line for ReLU is below the solid line.
* The dashed line for Tanh is above the solid line.
* The Tanh solid line decreases more rapidly than the ReLU solid line.
* The Tanh dashed line remains relatively constant.
### Interpretation
The chart compares the performance of ReLU and Tanh activation functions under different conditions, represented by the solid and dashed lines. The x-axis variable "α" likely represents a parameter or condition being varied. The solid lines suggest that both ReLU and Tanh performance decreases as "α" increases, but Tanh decreases more rapidly. The dashed lines represent a different scenario, where ReLU performance is slightly worse than the solid line scenario, while Tanh performance remains relatively constant. The error bars indicate the variability or uncertainty in the data points. The data suggests that the choice between ReLU and Tanh depends on the specific conditions represented by "α" and the solid/dashed lines.