## Line Chart: Loss vs. Alpha for ReLU and Tanh Activation Functions
### Overview
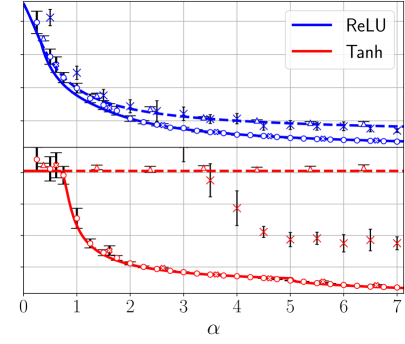
The image presents a line chart comparing the loss values for two activation functions, ReLU and Tanh, as a function of a parameter denoted as "α" (alpha). Each data point is accompanied by an error bar, indicating the variability or uncertainty in the loss measurement. The chart appears to be evaluating the performance of these activation functions across a range of alpha values.
### Components/Axes
* **X-axis:** Labeled "α", ranging from approximately 0 to 7.
* **Y-axis:** Represents the loss value. The scale is not explicitly labeled, but appears to range from approximately 0 to 1.
* **Data Series 1:** ReLU, represented by a solid blue line.
* **Data Series 2:** Tanh, represented by a solid red line.
* **Legend:** Located in the top-right corner, identifying the lines as ReLU (blue) and Tanh (red).
* **Data Points:** Each line is marked with data points. ReLU is marked with blue circles and crosses, while Tanh is marked with red circles and crosses.
* **Error Bars:** Vertical lines extending above and below each data point, indicating the standard deviation or confidence interval of the loss value.
### Detailed Analysis
**ReLU (Blue Line):**
The ReLU line starts at approximately 0.8 at α = 0 and rapidly decreases to around 0.2 by α = 1. The line then plateaus, exhibiting a slow, gradual decrease, leveling off to approximately 0.15-0.2 between α = 3 and α = 7. The data points show some variability, as indicated by the error bars.
* α = 0: Loss ≈ 0.8, Error ≈ 0.1
* α = 1: Loss ≈ 0.2, Error ≈ 0.05
* α = 2: Loss ≈ 0.18, Error ≈ 0.03
* α = 3: Loss ≈ 0.17, Error ≈ 0.04
* α = 4: Loss ≈ 0.16, Error ≈ 0.03
* α = 5: Loss ≈ 0.16, Error ≈ 0.02
* α = 6: Loss ≈ 0.16, Error ≈ 0.02
* α = 7: Loss ≈ 0.16, Error ≈ 0.02
**Tanh (Red Line):**
The Tanh line begins at approximately 0.6 at α = 0 and decreases more rapidly than ReLU initially, reaching a loss of around 0.1 by α = 1. It continues to decrease, but at a slower rate, eventually approaching a value of approximately 0.05-0.1 between α = 4 and α = 7. The error bars are generally smaller for Tanh than for ReLU, suggesting more consistent loss values.
* α = 0: Loss ≈ 0.6, Error ≈ 0.1
* α = 1: Loss ≈ 0.1, Error ≈ 0.03
* α = 2: Loss ≈ 0.08, Error ≈ 0.02
* α = 3: Loss ≈ 0.07, Error ≈ 0.02
* α = 4: Loss ≈ 0.06, Error ≈ 0.01
* α = 5: Loss ≈ 0.06, Error ≈ 0.01
* α = 6: Loss ≈ 0.06, Error ≈ 0.01
* α = 7: Loss ≈ 0.06, Error ≈ 0.01
### Key Observations
* Tanh consistently exhibits lower loss values than ReLU across the entire range of α.
* The rate of loss reduction is higher for both functions at lower α values (0-2).
* The error bars for ReLU are generally larger than those for Tanh, indicating greater variability in the loss measurements for ReLU.
* Both lines appear to converge as α increases, suggesting that the performance difference between ReLU and Tanh diminishes at higher α values.
### Interpretation
The chart demonstrates the impact of the α parameter on the loss function for ReLU and Tanh activation functions. The lower loss values achieved by Tanh suggest that it may be a more effective activation function for this particular task or dataset, especially at lower α values. The convergence of the lines at higher α values indicates that the choice of activation function becomes less critical as α increases. The error bars provide a measure of the robustness of each activation function, with Tanh exhibiting more consistent performance. This data could be used to optimize the choice of activation function and α parameter for a neural network model, aiming to minimize the loss and improve performance. The fact that the loss plateaus for ReLU suggests that increasing α beyond a certain point does not yield significant improvements in performance.