## Line Chart with Error Bars: Performance vs. α for ReLU and Tanh Activation Functions
### Overview
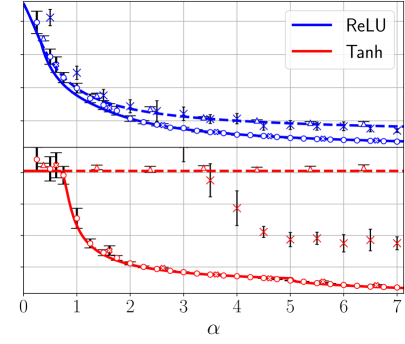
This is a technical line chart comparing the performance (y-axis, unlabeled but likely a metric like accuracy or loss) of two neural network activation functions, **ReLU** (blue) and **Tanh** (red), as a function of a parameter **α** (x-axis). The chart includes multiple data series for each function, distinguished by marker type, and all data points feature vertical error bars indicating variability or confidence intervals.
### Components/Axes
* **X-Axis:**
* **Label:** `α` (Greek letter alpha).
* **Scale:** Linear, ranging from 0 to 7.
* **Major Tick Marks:** At integer values 0, 1, 2, 3, 4, 5, 6, 7.
* **Y-Axis:**
* **Label:** Not explicitly labeled in the image.
* **Scale:** Linear. Based on the data points, the visible range is approximately from 0.1 to 1.0.
* **Grid Lines:** Horizontal and vertical grid lines are present, aiding in value estimation.
* **Legend:**
* **Position:** Top-right corner of the chart area.
* **Content:** Two entries.
1. A blue line labeled `ReLU`.
2. A red line labeled `Tanh`.
* **Data Series & Markers:**
* **ReLU (Blue):** Three distinct series are visible, differentiated by markers.
1. **Blue line with circle markers (`o`):** The highest-performing ReLU series.
2. **Blue line with cross markers (`x`):** The middle-performing ReLU series.
3. **Blue line with plus markers (`+`):** The lowest-performing ReLU series.
* **Tanh (Red):** Three distinct series are visible, differentiated by markers.
1. **Red line with circle markers (`o`):** A relatively flat, high-performing Tanh series.
2. **Red line with cross markers (`x`):** A Tanh series that declines sharply.
3. **Red line with plus markers (`+`):** The lowest-performing Tanh series, showing the steepest decline.
* **Error Bars:** Vertical black lines extending above and below each data point, representing uncertainty (e.g., standard deviation or standard error).
### Detailed Analysis
**Trend Verification & Data Point Extraction (Approximate Values):**
* **ReLU Series (Blue):**
* **General Trend:** All three ReLU series show a **monotonic decreasing trend** as α increases. The rate of decrease is steepest for low α (0 to ~2) and becomes more gradual for higher α.
* **Circle Series (Top Blue):** Starts at α=0 with a value of ~0.95. Decreases to ~0.85 at α=1, ~0.78 at α=2, and continues a slow decline to ~0.70 at α=7.
* **Cross Series (Middle Blue):** Starts at α=0 with a value of ~0.90. Decreases to ~0.80 at α=1, ~0.72 at α=2, and ends at ~0.65 at α=7.
* **Plus Series (Bottom Blue):** Starts at α=0 with a value of ~0.85. Decreases to ~0.75 at α=1, ~0.68 at α=2, and ends at ~0.60 at α=7.
* **Error Bars:** For ReLU, error bars are relatively small and consistent across the α range, suggesting stable variance.
* **Tanh Series (Red):**
* **General Trend:** The trends are more varied. One series is nearly flat, while the other two show a **sharp initial decline** followed by a slower decrease.
* **Circle Series (Top Red):** This series is an outlier among the Tanh data. It starts at α=0 with a value of ~0.50 and remains remarkably flat, ending at α=7 with a value of ~0.48. Its error bars are very small.
* **Cross Series (Middle Red):** Starts at α=0 with a value of ~0.50. Experiences a sharp drop to ~0.35 at α=1 and ~0.28 at α=2. The decline continues more gradually, reaching ~0.22 at α=7.
* **Plus Series (Bottom Red):** Starts at α=0 with a value of ~0.50. Shows the most dramatic drop, falling to ~0.20 at α=1 and ~0.17 at α=2. It continues to decline slowly, ending at ~0.15 at α=7.
* **Error Bars:** For the declining Tanh series (cross and plus), error bars are notably larger at low α (0-2), indicating higher variance in performance when α is small. The flat Tanh series (circle) has minimal error bars.
### Key Observations
1. **Clear Performance Gap:** The ReLU activation function (all blue lines) consistently achieves a higher metric value than the Tanh function (all red lines) across the entire range of α shown.
2. **Divergent Tanh Behavior:** One Tanh configuration (circle markers) is stable and unaffected by α, while the other two configurations are highly sensitive, performing poorly as α increases.
3. **Impact of α:** For most series (5 out of 6), increasing the parameter α has a negative impact on the measured performance metric. The effect is most pronounced for Tanh (excluding the stable series) at low α values.
4. **Variance Patterns:** Higher variance (larger error bars) is associated with the declining Tanh series at low α, suggesting less predictable performance in that region.
### Interpretation
This chart likely illustrates the sensitivity of different neural network configurations (perhaps different architectures or initializations, represented by the different markers) to a hyperparameter `α`, using two common activation functions.
* **What the data suggests:** The data strongly suggests that **ReLU is more robust and performs better than Tanh** for the task and metric being measured, across a wide range of `α` values. The stability of the top Tanh line indicates that under one specific condition, Tanh can be made robust to `α`, but this is not the general case.
* **Relationship between elements:** The parameter `α` acts as a stressor. The chart reveals how the fundamental choice of activation function (ReLU vs. Tanh) dictates the system's resilience to this stressor. The different marker series likely represent other factors (e.g., network depth, width) that interact with the activation function choice.
* **Notable anomalies:** The flat red line (Tanh-circle) is a significant anomaly. It demonstrates that the negative trend is not inherent to Tanh itself but to specific configurations of it. Investigating what makes this configuration unique would be a key next step. The large error bars for Tanh at low `α` indicate a region of instability where performance is not only lower but also less reliable.
**Language Note:** The only non-English text present is the Greek letter `α` (alpha) used as the x-axis label. It is a standard mathematical symbol.