## Line Graph: Comparison of ReLU and Tanh Activation Functions
### Overview
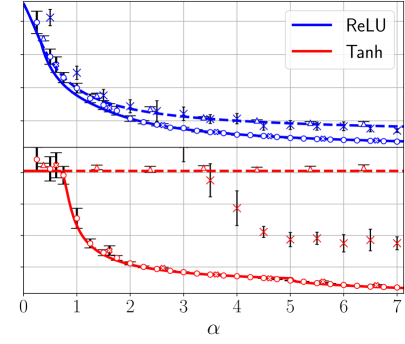
The graph compares two activation functions, ReLU (blue dashed line) and Tanh (red solid line), across a parameter α ranging from 0 to 7. Both lines show decreasing trends, with ReLU maintaining higher values than Tanh across the α range. Error bars are present for data points, indicating measurement uncertainty.
### Components/Axes
- **X-axis (α)**: Labeled "α", ranging from 0 to 7 in integer increments.
- **Y-axis**: Unlabeled, with values approximately between 0 and 1.2.
- **Legend**: Located in the top-right corner, with:
- **Blue dashed line**: ReLU
- **Red solid line**: Tanh
- **Data Points**:
- ReLU: Open circles with error bars (blue).
- Tanh: Crosses with error bars (red).
### Detailed Analysis
1. **ReLU (Blue Dashed Line)**:
- Starts at ~1.2 at α=0.
- Gradually decreases to ~0.8 by α=7.
- Error bars are small and consistent (~±0.05–0.1) across all α values.
- Trend: Smooth, gradual decline with minimal fluctuation.
2. **Tanh (Red Solid Line)**:
- Starts at ~0.8 at α=0.
- Drops sharply to ~0.2 by α=2, then plateaus.
- Error bars increase in size as α increases (e.g., ~±0.1 at α=0 to ±0.3 at α=7).
- Trend: Steeper initial decline, followed by stabilization.
### Key Observations
- ReLU consistently outperforms Tanh in magnitude across all α values.
- Tanh exhibits a more pronounced sensitivity to α, with a sharp drop in the first two units of α.
- Error bars for Tanh grow larger at higher α values, suggesting increased variability or measurement uncertainty in this region.
- ReLU’s error bars remain relatively stable, indicating more reliable measurements.
### Interpretation
The graph demonstrates that ReLU activation functions retain higher output values than Tanh for the tested α range. The steeper decline in Tanh suggests it may be less robust or more sensitive to changes in α, particularly in the early range (α=0–2). The increasing error bars for Tanh at higher α values could imply that its performance becomes less predictable or that measurements in this region are noisier. This might influence the choice of activation function depending on the application’s requirements for stability and sensitivity to α. The exact meaning of α (e.g., learning rate, scaling factor) would clarify the practical implications, but the data strongly favors ReLU in scenarios prioritizing higher and more consistent outputs.