## Line Charts: RLM vs Standard Benchmark Scores for Varying Model Sizes
### Overview
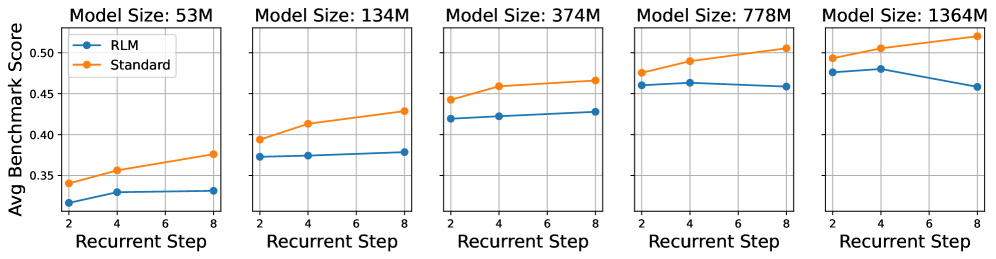
The image presents a series of five line charts comparing the performance of two models, "RLM" and "Standard," across different model sizes (53M, 134M, 374M, 778M, and 1364M). Each chart plots the average benchmark score against the recurrent step, ranging from 2 to 8. The charts are arranged horizontally, with model size increasing from left to right.
### Components/Axes
* **X-axis (Horizontal):** "Recurrent Step" with values 2, 4, 6, and 8.
* **Y-axis (Vertical):** "Avg Benchmark Score" ranging from approximately 0.32 to 0.52.
* **Legend (Top-Left of the first chart):**
* Blue line with circular markers: "RLM"
* Orange line with circular markers: "Standard"
* **Chart Titles:** Each chart is titled with "Model Size: [Size]M," where [Size] is 53, 134, 374, 778, or 1364.
### Detailed Analysis
**Model Size: 53M**
* **RLM (Blue):** Starts at approximately 0.32 at step 2, increases to approximately 0.33 at step 4, remains relatively flat at step 6, and ends at approximately 0.33 at step 8.
* **Standard (Orange):** Starts at approximately 0.34 at step 2, increases to approximately 0.36 at step 4, increases to approximately 0.37 at step 6, and ends at approximately 0.38 at step 8.
**Model Size: 134M**
* **RLM (Blue):** Starts at approximately 0.37 at step 2, increases to approximately 0.38 at step 4, remains relatively flat at step 6, and ends at approximately 0.38 at step 8.
* **Standard (Orange):** Starts at approximately 0.40 at step 2, increases to approximately 0.42 at step 4, increases to approximately 0.43 at step 6, and ends at approximately 0.43 at step 8.
**Model Size: 374M**
* **RLM (Blue):** Starts at approximately 0.42 at step 2, increases to approximately 0.425 at step 4, remains relatively flat at step 6, and ends at approximately 0.43 at step 8.
* **Standard (Orange):** Starts at approximately 0.445 at step 2, increases to approximately 0.46 at step 4, remains relatively flat at step 6, and ends at approximately 0.465 at step 8.
**Model Size: 778M**
* **RLM (Blue):** Starts at approximately 0.46 at step 2, increases to approximately 0.465 at step 4, remains relatively flat at step 6, and ends at approximately 0.46 at step 8.
* **Standard (Orange):** Starts at approximately 0.48 at step 2, increases to approximately 0.50 at step 4, remains relatively flat at step 6, and ends at approximately 0.505 at step 8.
**Model Size: 1364M**
* **RLM (Blue):** Starts at approximately 0.48 at step 2, decreases to approximately 0.475 at step 4, remains relatively flat at step 6, and ends at approximately 0.46 at step 8.
* **Standard (Orange):** Starts at approximately 0.49 at step 2, increases to approximately 0.51 at step 4, remains relatively flat at step 6, and ends at approximately 0.52 at step 8.
### Key Observations
* The "Standard" model consistently outperforms the "RLM" model across all model sizes and recurrent steps.
* For smaller model sizes (53M and 134M), both models show a more pronounced increase in benchmark score as the recurrent step increases.
* As model size increases, the performance gain from increasing the recurrent step diminishes for both models.
* For the largest model size (1364M), the "RLM" model shows a slight decrease in performance at higher recurrent steps.
### Interpretation
The data suggests that the "Standard" model architecture is more effective than the "RLM" architecture across the tested model sizes and recurrent steps. The diminishing returns observed with increasing recurrent steps, especially for larger models, indicate that there may be a point of saturation where additional recurrent steps do not significantly improve performance. The slight performance decrease of the "RLM" model at the largest model size suggests that this architecture may not scale as effectively as the "Standard" model. Further investigation would be needed to determine the underlying reasons for these performance differences and to optimize the models for different sizes and recurrent step configurations.