## Line Chart: Benchmark Score vs. Recurrent Step for Different Model Sizes
### Overview
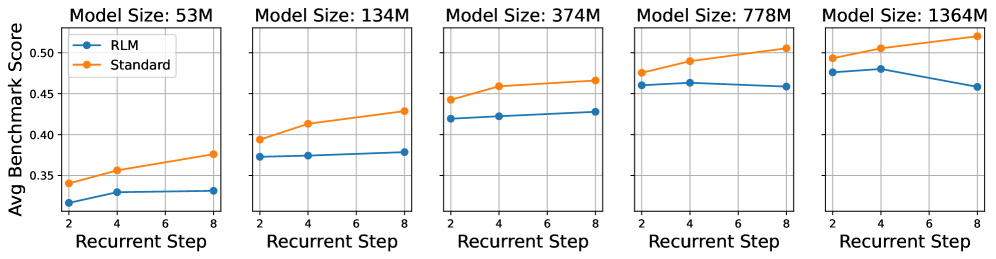
The image presents a series of five line charts, each representing the average benchmark score for two methods (RLM and Standard) across different recurrent steps, with each chart corresponding to a specific model size. The x-axis represents the recurrent step (ranging from 2 to 8), and the y-axis represents the average benchmark score (ranging from approximately 0.3 to 0.55).
### Components/Axes
* **Title:** Each chart is labeled with "Model Size: [Size in M]", where Size is 53M, 134M, 374M, 778M, or 1364M.
* **X-axis:** "Recurrent Step" with markers at 2, 4, 6, and 8.
* **Y-axis:** "Avg Benchmark Score" with a scale ranging from approximately 0.3 to 0.55.
* **Legend:** Located in the top-left corner of each chart.
* Blue Line: "RLM"
* Orange Line: "Standard"
* **Gridlines:** Present in each chart to aid in reading values.
### Detailed Analysis or Content Details
**Chart 1: Model Size: 53M**
* **RLM (Blue Line):** The line slopes upward from approximately 0.32 at step 2 to approximately 0.42 at step 8.
* Step 2: ~0.32
* Step 4: ~0.36
* Step 6: ~0.39
* Step 8: ~0.42
* **Standard (Orange Line):** The line slopes upward from approximately 0.36 at step 2 to approximately 0.45 at step 8.
* Step 2: ~0.36
* Step 4: ~0.40
* Step 6: ~0.42
* Step 8: ~0.45
**Chart 2: Model Size: 134M**
* **RLM (Blue Line):** The line initially decreases from approximately 0.38 at step 2 to approximately 0.36 at step 4, then increases to approximately 0.42 at step 8.
* Step 2: ~0.38
* Step 4: ~0.36
* Step 6: ~0.40
* Step 8: ~0.42
* **Standard (Orange Line):** The line slopes upward from approximately 0.40 at step 2 to approximately 0.48 at step 8.
* Step 2: ~0.40
* Step 4: ~0.43
* Step 6: ~0.45
* Step 8: ~0.48
**Chart 3: Model Size: 374M**
* **RLM (Blue Line):** The line is relatively flat, increasing slightly from approximately 0.42 at step 2 to approximately 0.44 at step 8.
* Step 2: ~0.42
* Step 4: ~0.43
* Step 6: ~0.43
* Step 8: ~0.44
* **Standard (Orange Line):** The line slopes upward from approximately 0.44 at step 2 to approximately 0.51 at step 8.
* Step 2: ~0.44
* Step 4: ~0.47
* Step 6: ~0.49
* Step 8: ~0.51
**Chart 4: Model Size: 778M**
* **RLM (Blue Line):** The line is relatively flat, fluctuating around approximately 0.45.
* Step 2: ~0.45
* Step 4: ~0.46
* Step 6: ~0.45
* Step 8: ~0.46
* **Standard (Orange Line):** The line slopes upward from approximately 0.47 at step 2 to approximately 0.53 at step 8.
* Step 2: ~0.47
* Step 4: ~0.50
* Step 6: ~0.51
* Step 8: ~0.53
**Chart 5: Model Size: 1364M**
* **RLM (Blue Line):** The line slopes downward from approximately 0.48 at step 2 to approximately 0.44 at step 8.
* Step 2: ~0.48
* Step 4: ~0.47
* Step 6: ~0.46
* Step 8: ~0.44
* **Standard (Orange Line):** The line slopes upward from approximately 0.50 at step 2 to approximately 0.55 at step 8.
* Step 2: ~0.50
* Step 4: ~0.52
* Step 6: ~0.53
* Step 8: ~0.55
### Key Observations
* The "Standard" method consistently outperforms the "RLM" method across all model sizes and recurrent steps.
* For smaller model sizes (53M and 134M), both methods show a clear positive correlation between recurrent step and benchmark score.
* For larger model sizes (374M, 778M, and 1364M), the "RLM" method's performance plateaus or even decreases with increasing recurrent steps, while the "Standard" method continues to improve.
* The gap in performance between the two methods widens as the model size increases.
### Interpretation
The data suggests that the "Standard" method is more scalable and benefits more from increased recurrent steps, particularly in larger models. The "RLM" method appears to reach a point of diminishing returns or even degradation in performance with larger models and higher recurrent steps. This could indicate that the "RLM" method is more sensitive to overfitting or requires more careful tuning for larger models. The consistent outperformance of the "Standard" method suggests it may be a more robust and generalizable approach. The increasing gap in performance with larger models highlights the importance of considering model size when choosing between these two methods. The charts demonstrate a clear trade-off between model complexity (size) and the benefits of increasing recurrent steps, with the "Standard" method being better positioned to capitalize on the latter.