## Line Chart: Advantage σ vs. Global Step for Different GRPO Methods
### Overview
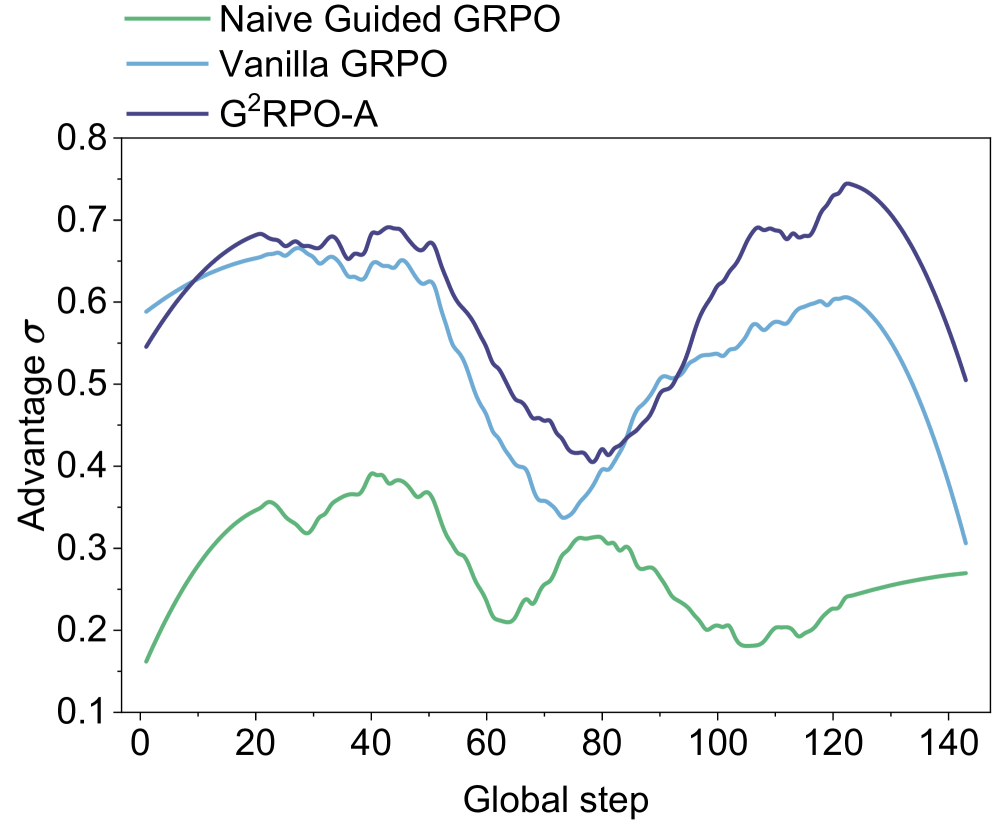
The image is a line chart comparing the "Advantage σ" over "Global step" for three different Guided Risk Parity Optimization (GRPO) methods: Naive Guided GRPO, Vanilla GRPO, and G²RPO-A. The chart visualizes the performance of these methods across a range of global steps, showing how their advantage changes over time.
### Components/Axes
* **X-axis:** "Global step", ranging from 0 to 140 in increments of 20.
* **Y-axis:** "Advantage σ", ranging from 0.1 to 0.8 in increments of 0.1.
* **Legend (top-left):**
* Green line: Naive Guided GRPO
* Light Blue line: Vanilla GRPO
* Dark Blue line: G²RPO-A
### Detailed Analysis
* **Naive Guided GRPO (Green):**
* Trend: Starts at approximately 0.16, increases to a peak around 0.39 at global step 40, then decreases to a local minimum around 0.20 at global step 80, and finally increases again to approximately 0.27 at global step 140.
* Data Points:
* Global step 0: ~0.16
* Global step 40: ~0.39
* Global step 80: ~0.20
* Global step 140: ~0.27
* **Vanilla GRPO (Light Blue):**
* Trend: Starts at approximately 0.58, increases to a peak around 0.66 at global step 40, then decreases to a minimum around 0.35 at global step 120, and finally increases slightly to approximately 0.31 at global step 140.
* Data Points:
* Global step 0: ~0.58
* Global step 40: ~0.66
* Global step 80: ~0.55
* Global step 120: ~0.35
* Global step 140: ~0.31
* **G²RPO-A (Dark Blue):**
* Trend: Starts at approximately 0.54, increases to a peak around 0.70 at global step 40, then decreases to a minimum around 0.41 at global step 80, and finally increases again to approximately 0.50 at global step 140.
* Data Points:
* Global step 0: ~0.54
* Global step 40: ~0.70
* Global step 80: ~0.41
* Global step 140: ~0.50
### Key Observations
* G²RPO-A generally maintains the highest "Advantage σ" throughout the global steps, except for the very beginning where Vanilla GRPO is slightly higher.
* Naive Guided GRPO consistently shows the lowest "Advantage σ" compared to the other two methods.
* All three methods experience a decrease in "Advantage σ" between global steps 40 and 80.
* Vanilla GRPO experiences the most significant drop in "Advantage σ" towards the end of the global steps.
### Interpretation
The chart suggests that G²RPO-A is the most effective method among the three in terms of maintaining a higher "Advantage σ" over the global steps. Naive Guided GRPO appears to be the least effective. The performance of Vanilla GRPO degrades significantly towards the later global steps. The cyclical nature of the "Advantage σ" for all methods indicates a possible pattern or external factor influencing their performance as the global step increases. The data implies that the choice of GRPO method significantly impacts the achieved advantage, and G²RPO-A may be a preferred choice based on this data.