## Line Chart: Comparison of Advantage σ Across Global Steps for Three GRPO Variants
### Overview
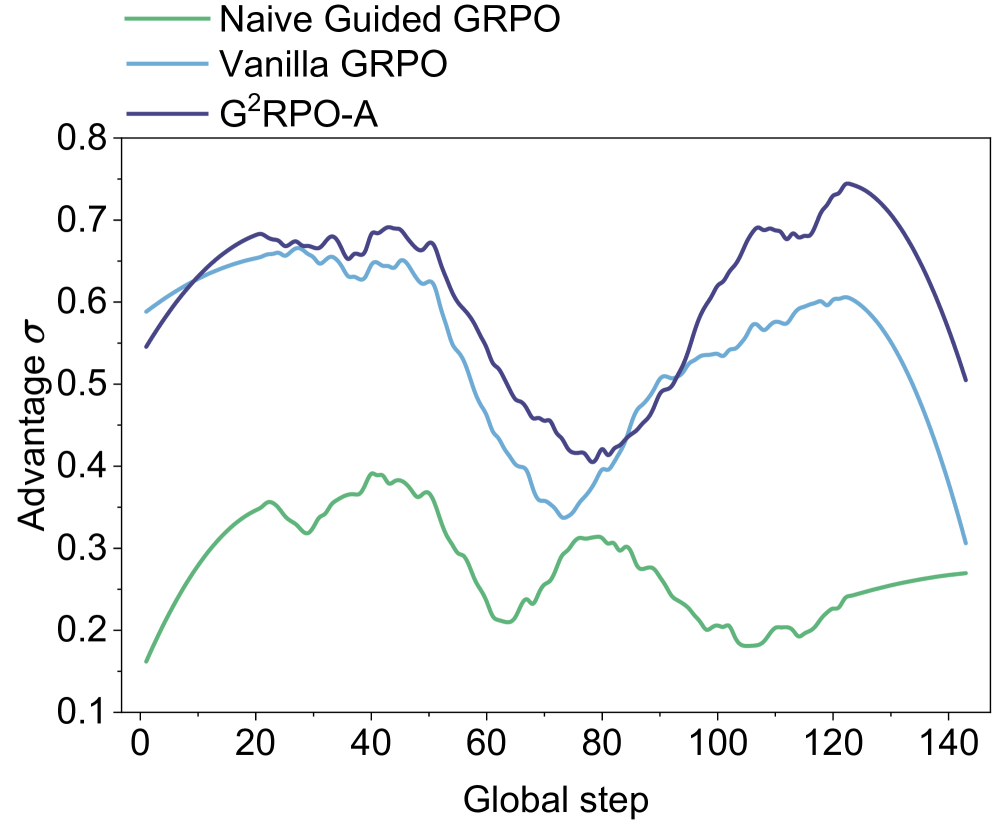
The image displays a line chart comparing the performance of three different algorithms—Naive Guided GRPO, Vanilla GRPO, and G²RPO-A—over the course of training, measured in "Global step." The performance metric is "Advantage σ." The chart shows that all three methods exhibit fluctuating performance, with G²RPO-A generally maintaining the highest advantage values throughout the observed period.
### Components/Axes
* **Chart Type:** Line chart with three data series.
* **X-Axis:**
* **Label:** "Global step"
* **Scale:** Linear, ranging from 0 to 140.
* **Major Tick Marks:** 0, 20, 40, 60, 80, 100, 120, 140.
* **Y-Axis:**
* **Label:** "Advantage σ"
* **Scale:** Linear, ranging from 0.1 to 0.8.
* **Major Tick Marks:** 0.1, 0.2, 0.3, 0.4, 0.5, 0.6, 0.7, 0.8.
* **Legend:**
* **Position:** Top-left corner of the chart area.
* **Entries:**
1. **Naive Guided GRPO:** Represented by a green line.
2. **Vanilla GRPO:** Represented by a light blue line.
3. **G²RPO-A:** Represented by a dark blue/purple line.
### Detailed Analysis
**1. Naive Guided GRPO (Green Line):**
* **Trend:** Starts at the lowest point among the three, rises to a moderate peak, then generally declines with some fluctuations, ending with a slight upward trend.
* **Key Data Points (Approximate):**
* Step 0: ~0.16
* Step 20: ~0.35
* Step 40: ~0.39 (Peak)
* Step 60: ~0.21
* Step 80: ~0.31
* Step 100: ~0.20
* Step 120: ~0.24
* Step 140: ~0.27
**2. Vanilla GRPO (Light Blue Line):**
* **Trend:** Starts relatively high, rises to an early peak, experiences a significant mid-training dip, recovers to a second peak, and then declines sharply towards the end.
* **Key Data Points (Approximate):**
* Step 0: ~0.59
* Step 20: ~0.66
* Step 30: ~0.67 (First Peak)
* Step 60: ~0.45
* Step 75: ~0.34 (Trough)
* Step 100: ~0.54
* Step 120: ~0.60 (Second Peak)
* Step 140: ~0.31
**3. G²RPO-A (Dark Blue/Purple Line):**
* **Trend:** Follows a pattern similar to Vanilla GRPO but consistently maintains a higher advantage value after the initial steps. It reaches the highest overall peak on the chart.
* **Key Data Points (Approximate):**
* Step 0: ~0.55
* Step 20: ~0.68
* Step 45: ~0.69 (First Peak)
* Step 60: ~0.55
* Step 75: ~0.40 (Trough)
* Step 100: ~0.62
* Step 120: ~0.75 (Highest Peak on Chart)
* Step 140: ~0.51
### Key Observations
1. **Performance Hierarchy:** G²RPO-A (dark blue) consistently outperforms Vanilla GRPO (light blue) after approximately step 10, and both significantly outperform Naive Guided GRPO (green) for the entire duration.
2. **Correlated Fluctuations:** The Vanilla GRPO and G²RPO-A lines show highly correlated movement patterns—rising and falling in near unison—suggesting they may be responding similarly to training dynamics, with G²RPO-A maintaining a performance offset.
3. **Mid-Training Dip:** All three methods experience a notable performance dip between global steps 60 and 80. The recovery from this dip is much stronger for Vanilla GRPO and G²RPO-A than for Naive Guided GRPO.
4. **Late-Stage Divergence:** After step 120, the performance of Vanilla GRPO and G²RPO-A diverges sharply downward, while Naive Guided GRPO shows a slight upward trend, though it remains at a much lower absolute advantage level.
5. **Peak Performance:** The single highest advantage value (~0.75) is achieved by G²RPO-A around step 120.
### Interpretation
This chart likely visualizes a key performance metric from a reinforcement learning or optimization experiment. "Advantage σ" probably represents a measure of policy improvement or reward advantage, with higher values being better. "Global step" represents training iterations.
The data suggests that the **G²RPO-A** algorithm is the most effective of the three, achieving the highest peak advantage and maintaining a lead over **Vanilla GRPO** throughout most of the training process. The strong correlation between these two lines implies that G²RPO-A may be an enhanced version of Vanilla GRPO that provides a consistent performance boost.
The **Naive Guided GRPO** method performs poorly in comparison, indicating that its guiding mechanism may be ineffective or even detrimental compared to the other approaches. The universal dip around steps 60-80 could point to a challenging phase in the training environment, a change in data distribution, or a common instability in the optimization process that all algorithms face, albeit with different resilience.
The sharp late-stage decline for the two better-performing methods is a critical observation. It could indicate overfitting, catastrophic forgetting, or that the policy has entered a region of the state space where the advantage estimate becomes unstable. In contrast, the slight rise of the naive method at the end might suggest it is learning a simpler, more stable, but ultimately suboptimal policy. The chart effectively demonstrates not just which method is best on average, but how their performance dynamics differ across the entire training timeline.