## Line Graph: Advantage σ vs Global Step
### Overview
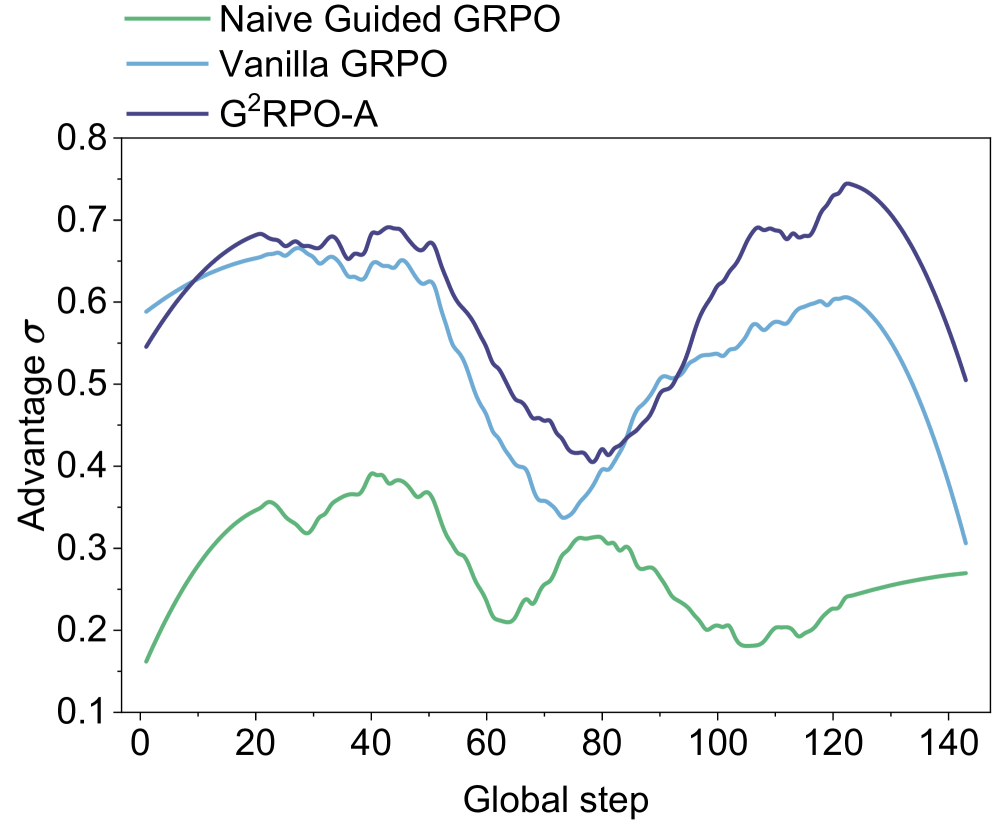
The image is a line graph comparing three optimization algorithms—Naive Guided GRPO (green), Vanilla GRPO (blue), and G²RPO-A (purple)—across 140 global steps. The y-axis measures "Advantage σ" (ranging from 0.1 to 0.8), while the x-axis represents "Global step" (0 to 140). The legend is positioned at the top-left corner, with each line color-coded to its corresponding algorithm.
### Components/Axes
- **X-axis (Global step)**: Labeled with increments of 20 (0, 20, 40, ..., 140).
- **Y-axis (Advantage σ)**: Labeled with increments of 0.1 (0.1, 0.2, ..., 0.8).
- **Legend**: Top-left corner, mapping:
- Green: Naive Guided GRPO
- Blue: Vanilla GRPO
- Purple: G²RPO-A
### Detailed Analysis
1. **Naive Guided GRPO (Green)**:
- Starts at ~0.15 at step 0.
- Peaks at ~0.35 around step 40.
- Declines to ~0.25 by step 100, then stabilizes at ~0.28 by step 140.
- Trend: Initial rise, followed by gradual decline and stabilization.
2. **Vanilla GRPO (Blue)**:
- Begins at ~0.58 at step 0.
- Peaks at ~0.65 around step 20.
- Dips to ~0.35 at step 80, then rises to ~0.6 by step 120.
- Trend: Volatile with a mid-step trough and late-stage recovery.
3. **G²RPO-A (Purple)**:
- Starts at ~0.55 at step 0.
- Peaks at ~0.72 around step 120.
- Dips to ~0.4 at step 80, then rises sharply to ~0.72 by step 120.
- Trend: Early decline, mid-step trough, and late-stage dominance.
### Key Observations
- **G²RPO-A (Purple)** achieves the highest "Advantage σ" (~0.72) at step 120, outperforming others in later steps.
- **Naive Guided GRPO (Green)** consistently underperforms, with values never exceeding ~0.35.
- **Vanilla GRPO (Blue)** shows mid-range performance but exhibits significant volatility, dropping to ~0.35 at step 80 before recovering.
### Interpretation
The data suggests that **G²RPO-A** is the most effective algorithm for maximizing "Advantage σ" as global steps increase, particularly after step 100. Its late-stage peak (~0.72) indicates superior scalability or efficiency in later optimization phases. In contrast, **Naive Guided GRPO** demonstrates limited effectiveness, with values remaining below 0.4 throughout. **Vanilla GRPO** exhibits intermediate performance but suffers from instability, as evidenced by its mid-step trough. The trends highlight trade-offs between stability (Vanilla GRPO) and scalability (G²RPO-A), with the latter emerging as the optimal choice for long-term optimization tasks.