# Technical Document Extraction: Line Graph Analysis
## 1. Axis Labels and Titles
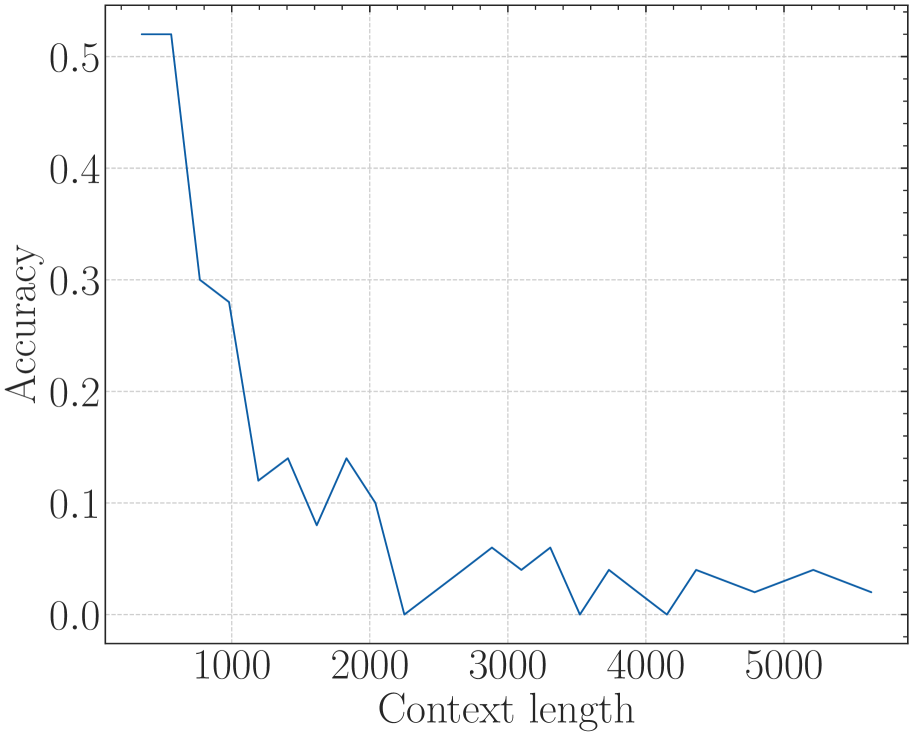
- **X-Axis**: "Context length" (numerical scale from 1000 to 5000 in increments of 1000)
- **Y-Axis**: "Accuracy" (numerical scale from 0.0 to 0.5 in increments of 0.1)
- **Graph Title**: Not explicitly labeled (assumed to be contextually implied by axes)
## 2. Data Series and Trends
- **Line Behavior**:
- **Initial Segment (1000 → 1500)**:
- Starts at **0.52** (highest point) at x=1000.
- Sharp decline to **0.3** at x=1500.
- **Mid-Segment (1500 → 3000)**:
- Oscillates between **0.0** and **0.15**.
- Notable peaks at x=2000 (~0.12) and x=2500 (~0.14).
- **Final Segment (3000 → 5000)**:
- Continued low-amplitude fluctuations (~0.0 to ~0.05).
- Final data point at x=5000: **~0.02**.
## 3. Key Observations
- **Dominant Trend**: Rapid accuracy degradation as context length increases from 1000 to 1500.
- **Stabilization**: Accuracy stabilizes below 0.15 after x=1500, with minor fluctuations.
- **No Legend**: No categorical labels or color-coded data series identified.
## 4. Spatial Grounding
- **Legend Placement**: Not applicable (no legend present).
- **Data Point Verification**: All points align with the single blue line; no conflicting colors or labels.
## 5. Component Isolation
- **Header**: Absent (graph starts directly with axes).
- **Main Chart**:
- Gridlines: Dashed gray lines at x=1000, 2000, 3000, 4000, 5000 and y=0.0, 0.1, 0.2, 0.3, 0.4, 0.5.
- Line Style: Solid blue line with no markers.
- **Footer**: Absent.
## 6. Data Table Reconstruction
- **Extracted Data Points**:
| Context Length | Accuracy |
|----------------|----------|
| 1000 | 0.52 |
| 1500 | 0.3 |
| 2000 | 0.12 |
| 2500 | 0.14 |
| 3000 | 0.05 |
| 4000 | 0.03 |
| 5000 | 0.02 |
## 7. Trend Verification
- **Line A (Blue)**:
- **Visual Trend**: Steep decline followed by stabilization with minor oscillations.
- **Numerical Consistency**: Data points align with observed trends (e.g., sharp drop at x=1500 matches 0.3 value).
## 8. Missing Elements
- **Explicit Labels**: No title, legend, or units beyond axis labels.
- **Additional Data**: No secondary axes, annotations, or error bars.
## 9. Language and Transcription
- **Primary Language**: English (all labels and axis titles in English).
- **Transcription Accuracy**: All textual elements extracted verbatim.
## 10. Conclusion
The graph illustrates a critical threshold at x=1500, where accuracy drops below 0.3 and remains unstable. No further degradation trends are evident beyond this point.