# Technical Data Extraction: Accuracy vs. Context Length
## 1. Image Classification
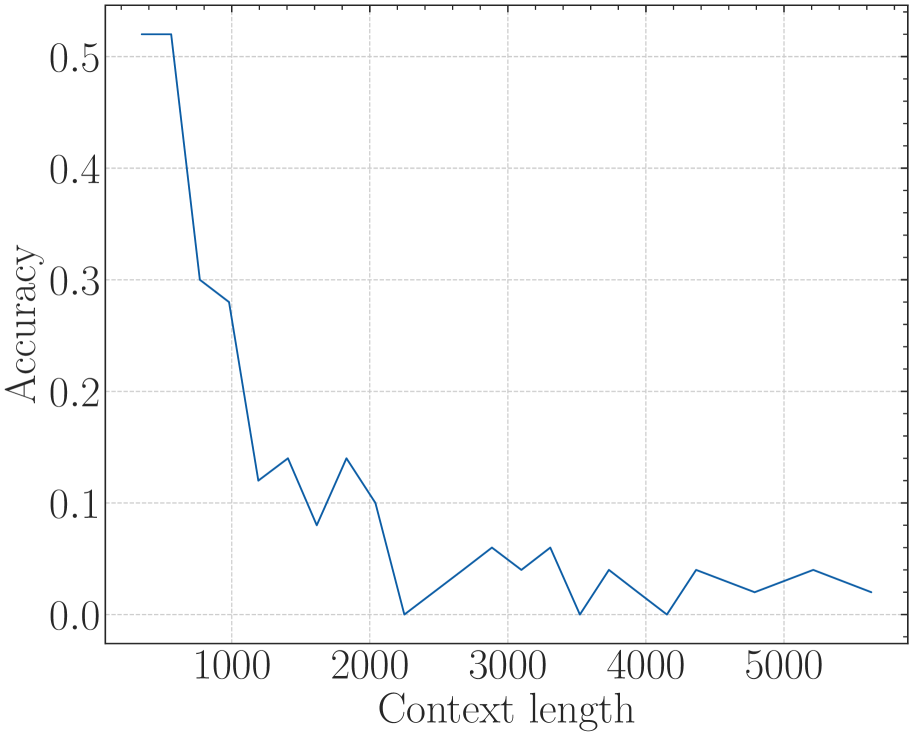
This image is a **line chart** depicting the relationship between a model's performance (Accuracy) and the length of the input context (Context length).
## 2. Component Isolation
### Header/Metadata
* **Title:** None present.
* **Language:** English.
### Main Chart Area
* **X-Axis Label:** "Context length"
* **Y-Axis Label:** "Accuracy"
* **Grid:** Light gray dashed grid lines for both major x and y intervals.
* **Data Series:** A single solid blue line.
### Legend
* **Presence:** No legend is present as there is only one data series.
---
## 3. Axis Scales and Markers
### X-Axis (Context length)
* **Range:** Approximately 400 to 5800.
* **Major Tick Labels:** 1000, 2000, 3000, 4000, 5000.
* **Minor Ticks:** Present between major labels, indicating intervals of 200 units.
### Y-Axis (Accuracy)
* **Range:** 0.0 to 0.55.
* **Major Tick Labels:** 0.0, 0.1, 0.2, 0.3, 0.4, 0.5.
* **Minor Ticks:** Present at intervals of 0.025.
---
## 4. Trend Verification and Data Extraction
### Visual Trend Analysis
The blue line exhibits a **sharp negative correlation** initially, followed by a **volatile plateau** at low values.
1. **Initial Phase (400 - 1200):** The line starts at its peak and drops precipitously.
2. **Transition Phase (1200 - 2200):** The line fluctuates with a downward bias, showing small "sawtooth" peaks.
3. **Degraded Phase (2200 - 5600):** The line remains near the baseline (0.0 to 0.06), oscillating frequently and hitting 0.0 at multiple points.
### Estimated Data Points
Based on the grid intersections and axis markers:
| Context length (approx.) | Accuracy (approx.) | Notes |
| :--- | :--- | :--- |
| 400 | 0.52 | Peak performance |
| 600 | 0.52 | Performance holds |
| 800 | 0.30 | Sharp drop |
| 1000 | 0.28 | Continued decline |
| 1200 | 0.12 | Local minimum |
| 1400 | 0.14 | Small recovery |
| 1600 | 0.08 | Local minimum |
| 1800 | 0.14 | Local peak |
| 2000 | 0.10 | Decline |
| 2200 | 0.00 | First zero-accuracy point |
| 2800 | 0.06 | Small recovery |
| 3000 | 0.04 | Decline |
| 3200 | 0.06 | Small recovery |
| 3500 | 0.00 | Second zero-accuracy point |
| 3700 | 0.04 | Small recovery |
| 4100 | 0.00 | Third zero-accuracy point |
| 4300 | 0.04 | Small recovery |
| 4800 | 0.02 | Decline |
| 5200 | 0.04 | Small recovery |
| 5600 | 0.02 | Final data point |
---
## 5. Summary of Findings
The chart demonstrates a significant degradation in model accuracy as the context length increases. The model maintains its highest accuracy (~0.52) only for very short contexts (under 600 units). By the time the context length reaches 2200 units, the accuracy effectively collapses, frequently hitting 0.0 and never recovering above 0.06 for the remainder of the tested range (up to 5600 units).