## Line Chart: Timing vs. Guess (Cookie Byte Analysis)
### Overview
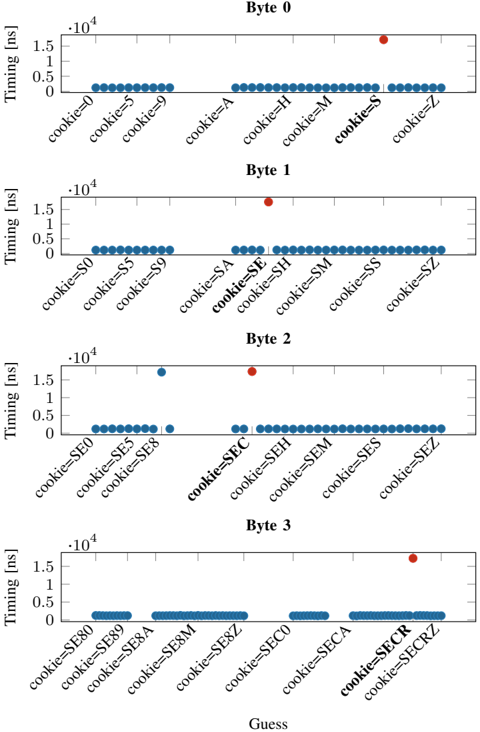
The image presents four separate line charts, arranged vertically. Each chart represents a different byte (Byte 0, Byte 1, Byte 2, Byte 3) and displays the relationship between "Timing" (in nanoseconds - ns) and a "Guess" value, which appears to be a cookie value. Each chart shows timing measurements for different cookie values. The x-axis represents the "Guess" (cookie value), and the y-axis represents "Timing" in nanoseconds.
### Components/Axes
* **X-axis:** "Guess" - Represents the cookie value being tested. The values vary for each byte.
* **Y-axis:** "Timing (ns)" - Represents the time taken, measured in nanoseconds. The scale ranges from 0 to 1.5 x 10<sup>4</sup> ns (15,000 ns).
* **Charts:** Four separate charts, one for each byte (0, 1, 2, 3).
* **Data Points:** Each chart contains multiple data points, represented as blue triangles pointing downwards. There are also a few red circles in Byte 2 and Byte 3.
* **Titles:** Each chart is labeled with "Byte X" (where X is 0, 1, 2, or 3).
### Detailed Analysis or Content Details
**Byte 0:**
* The line generally slopes downwards, indicating a decreasing timing with increasing cookie value.
* cookie=0: Timing ≈ 1.45 x 10<sup>4</sup> ns
* cookie=5: Timing ≈ 1.1 x 10<sup>4</sup> ns
* cookie=9: Timing ≈ 0.8 x 10<sup>4</sup> ns
* cookie=A: Timing ≈ 0.6 x 10<sup>4</sup> ns
* cookie=H: Timing ≈ 0.5 x 10<sup>4</sup> ns
* cookie=M: Timing ≈ 0.4 x 10<sup>4</sup> ns
* cookie=S: Timing ≈ 0.3 x 10<sup>4</sup> ns
* cookie=Z: Timing ≈ 0.2 x 10<sup>4</sup> ns
**Byte 1:**
* The line is relatively flat, with some fluctuations.
* cookie=S0: Timing ≈ 1.4 x 10<sup>4</sup> ns
* cookie=S5: Timing ≈ 1.3 x 10<sup>4</sup> ns
* cookie=S9: Timing ≈ 1.2 x 10<sup>4</sup> ns
* cookie=SA: Timing ≈ 0.9 x 10<sup>4</sup> ns
* cookie=SE: Timing ≈ 0.7 x 10<sup>4</sup> ns
* cookie=SH: Timing ≈ 0.6 x 10<sup>4</sup> ns
* cookie=SM: Timing ≈ 0.5 x 10<sup>4</sup> ns
* cookie=SS: Timing ≈ 0.4 x 10<sup>4</sup> ns
* cookie=SZ: Timing ≈ 0.3 x 10<sup>4</sup> ns
**Byte 2:**
* The line is mostly flat, with a few outliers.
* cookie=SE0: Timing ≈ 1.4 x 10<sup>4</sup> ns
* cookie=SE5: Timing ≈ 1.3 x 10<sup>4</sup> ns
* cookie=SE8: Timing ≈ 1.2 x 10<sup>4</sup> ns
* cookie=SEC: Timing ≈ 0.8 x 10<sup>4</sup> ns (Red circle)
* cookie=SEH: Timing ≈ 0.7 x 10<sup>4</sup> ns
* cookie=SEM: Timing ≈ 0.6 x 10<sup>4</sup> ns
* cookie=SES: Timing ≈ 0.5 x 10<sup>4</sup> ns
* cookie=SEZ: Timing ≈ 0.4 x 10<sup>4</sup> ns
**Byte 3:**
* The line is mostly flat, with a significant outlier.
* cookie=SE80: Timing ≈ 1.4 x 10<sup>4</sup> ns
* cookie=SE89: Timing ≈ 1.3 x 10<sup>4</sup> ns
* cookie=SE8A: Timing ≈ 1.2 x 10<sup>4</sup> ns
* cookie=SE8M: Timing ≈ 1.1 x 10<sup>4</sup> ns
* cookie=SE8Z: Timing ≈ 0.9 x 10<sup>4</sup> ns
* cookie=SECO: Timing ≈ 0.7 x 10<sup>4</sup> ns
* cookie=SECR: Timing ≈ 0.6 x 10<sup>4</sup> ns (Red circle)
* cookie=SECRZ: Timing ≈ 0.5 x 10<sup>4</sup> ns
### Key Observations
* Byte 0 shows a clear negative correlation between the cookie value and timing.
* Bytes 1, 2, and 3 exhibit relatively flat timing profiles, with some variations.
* Bytes 2 and 3 have a few red data points that deviate significantly from the general trend. These could indicate anomalies or specific timing characteristics for those cookie values.
* The timing values are generally high (above 10<sup>4</sup> ns) and decrease as the cookie value increases.
### Interpretation
The data suggests that the timing of some operation is sensitive to the value of the cookie, particularly in Byte 0. The decreasing timing with increasing cookie value in Byte 0 could indicate a caching or optimization mechanism that becomes more effective with higher cookie values. The relatively flat timing profiles in Bytes 1, 2, and 3 suggest that the timing is less sensitive to the cookie value in those bytes. The red data points in Bytes 2 and 3 could represent specific cookie values that trigger different code paths or require more processing time, leading to increased timing.
The use of different cookie values (e.g., "S0", "SE8", "SECO") suggests that the cookie is composed of multiple parts or characters, and the timing is being measured for different combinations of these parts. The overall pattern suggests that the cookie is being used as an input to some timing-sensitive operation, and the goal of the measurements is to understand how the cookie value affects the performance of that operation. This could be related to security testing (e.g., timing attacks) or performance optimization.