## Heatmap Analysis
### Overview
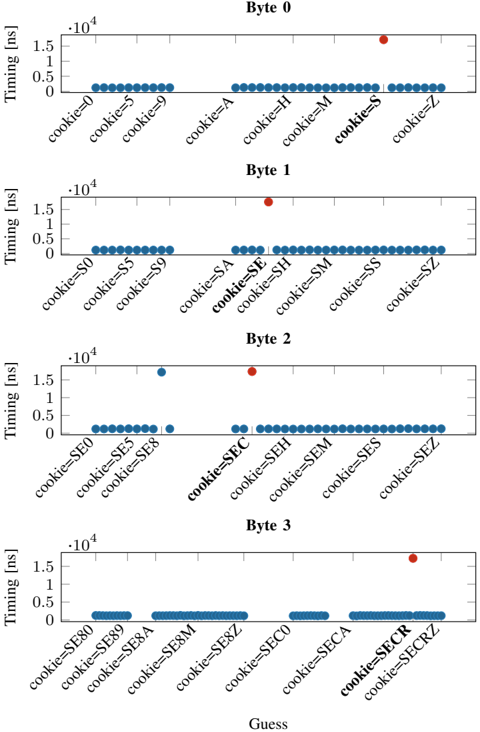
The image displays a heatmap with four axes labeled Byte 0, Byte 1, Byte 2, and Byte 3. Each byte is represented by a horizontal axis, and the heatmap shows the timing values in nanoseconds (ns) for different cookie values.
### Components/Axes
- **Byte 0**: The horizontal axis represents Byte 0, with values ranging from 0 to 1.5 x 10^4 ns.
- **Byte 1**: The horizontal axis represents Byte 1, with values ranging from 0 to 1.5 x 10^4 ns.
- **Byte 2**: The horizontal axis represents Byte 2, with values ranging from 0 to 1.5 x 10^4 ns.
- **Byte 3**: The horizontal axis represents Byte 3, with values ranging from 0 to 1.5 x 10^4 ns.
- **Cookies**: The vertical axis represents different cookie values, labeled from cookie=0 to cookie=SECRZ.
### Detailed Analysis or ### Content Details
The heatmap shows the timing values for each byte and cookie combination. The data points are represented by blue dots, and the red dot indicates a specific value of interest. The heatmap is color-coded, with darker shades representing higher timing values.
### Key Observations
- **Byte 0**: The majority of data points are clustered around the 0 ns mark, indicating that the timing values for Byte 0 are relatively low.
- **Byte 1**: The data points are more spread out, with some values reaching up to 1.5 x 10^4 ns.
- **Byte 2**: The data points are similar to Byte 1, with some values reaching up to 1.5 x 10^4 ns.
- **Byte 3**: The data points are similar to Byte 1 and Byte 2, with some values reaching up to 1.5 x 10^4 ns.
### Interpretation
The heatmap suggests that the timing values for Byte 0 are relatively low, while the timing values for Byte 1, Byte 2, and Byte 3 are higher. This could indicate that the timing values for Byte 0 are related to the cookie value, while the timing values for the other bytes are not. The red dot indicates a specific value of interest, which could be used to further investigate the relationship between the cookie value and the timing values.