## Bar Chart: Model Performance Comparison
### Overview
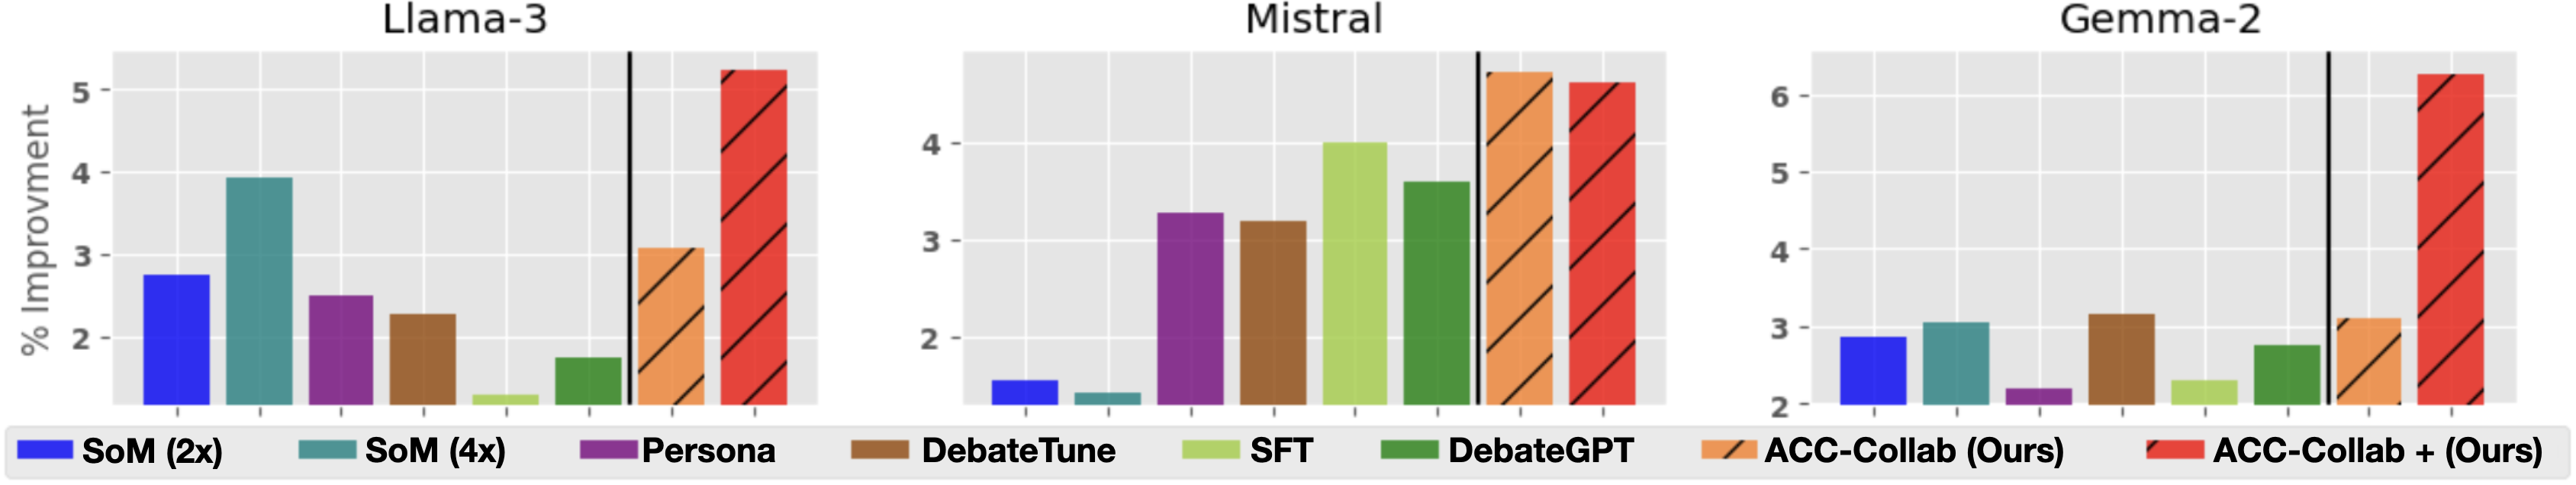
The image presents three bar charts comparing the performance of different models (Llama-3, Mistral, and Gemma-2) using various techniques. The y-axis represents the "% Improvement," and the x-axis represents different methods or models being compared. The legend at the bottom identifies the color-coded methods.
### Components/Axes
* **Titles:** Llama-3 (top-left), Mistral (top-center), Gemma-2 (top-right)
* **Y-axis:** "% Improvment" (vertical, left side of all charts). Scale ranges from 2 to 5 for Llama-3 and Mistral, and 2 to 6 for Gemma-2, with tick marks at each integer value.
* **X-axis:** Categorical, representing different methods/models. No explicit labels on the x-axis itself, but the legend provides the categories.
* **Legend:** Located at the bottom of the image.
* Blue: SoM (2x)
* Teal: SoM (4x)
* Purple: Persona
* Brown: DebateTune
* Light Green: SFT
* Dark Green: DebateGPT
* Orange (diagonal lines): ACC-Collab (Ours)
* Red (diagonal lines): ACC-Collab + (Ours)
* **Vertical Black Line:** A vertical black line is present in each chart, separating the first six methods from the last two.
### Detailed Analysis
**Llama-3 Chart:**
* **SoM (2x) (Blue):** Approximately 2.8% improvement.
* **SoM (4x) (Teal):** Approximately 3.9% improvement.
* **Persona (Purple):** Approximately 2.5% improvement.
* **DebateTune (Brown):** Approximately 2.3% improvement.
* **SFT (Light Green):** Approximately 1.3% improvement.
* **DebateGPT (Dark Green):** Approximately 1.7% improvement.
* **ACC-Collab (Ours) (Orange, diagonal lines):** Approximately 3.1% improvement.
* **ACC-Collab + (Ours) (Red, diagonal lines):** Approximately 5.3% improvement.
**Mistral Chart:**
* **SoM (2x) (Blue):** Approximately 1.5% improvement.
* **SoM (4x) (Teal):** Approximately 1.4% improvement.
* **Persona (Purple):** Approximately 3.3% improvement.
* **DebateTune (Brown):** Approximately 3.1% improvement.
* **SFT (Light Green):** Approximately 4.0% improvement.
* **DebateGPT (Dark Green):** Approximately 3.8% improvement.
* **ACC-Collab (Ours) (Orange, diagonal lines):** Approximately 5.3% improvement.
* **ACC-Collab + (Ours) (Red, diagonal lines):** Approximately 5.2% improvement.
**Gemma-2 Chart:**
* **SoM (2x) (Blue):** Approximately 2.9% improvement.
* **SoM (4x) (Teal):** Approximately 3.0% improvement.
* **Persona (Purple):** Approximately 2.1% improvement.
* **DebateTune (Brown):** Approximately 3.2% improvement.
* **SFT (Light Green):** Approximately 2.4% improvement.
* **DebateGPT (Dark Green):** Approximately 2.8% improvement.
* **ACC-Collab (Ours) (Orange, diagonal lines):** Approximately 3.1% improvement.
* **ACC-Collab + (Ours) (Red, diagonal lines):** Approximately 6.3% improvement.
### Key Observations
* **ACC-Collab + (Ours)** consistently shows the highest improvement across all three models (Llama-3, Mistral, and Gemma-2).
* **SFT** generally shows the lowest improvement among the first six methods.
* The performance of **SoM (2x)** and **SoM (4x)** varies across the models.
* The vertical black line separates the standard methods from the "Ours" methods, highlighting the comparison.
### Interpretation
The charts demonstrate the performance improvement achieved by different methods on three different language models. The "ACC-Collab + (Ours)" method consistently outperforms the other methods, suggesting it is the most effective technique for improving the performance of these models. The relative performance of the other methods varies depending on the specific model being used. The separation of the "Ours" methods by a vertical line emphasizes their superior performance compared to the standard methods.