\n
## Bar Chart: Comparative Performance of Various Methods Across Three Language Models
### Overview
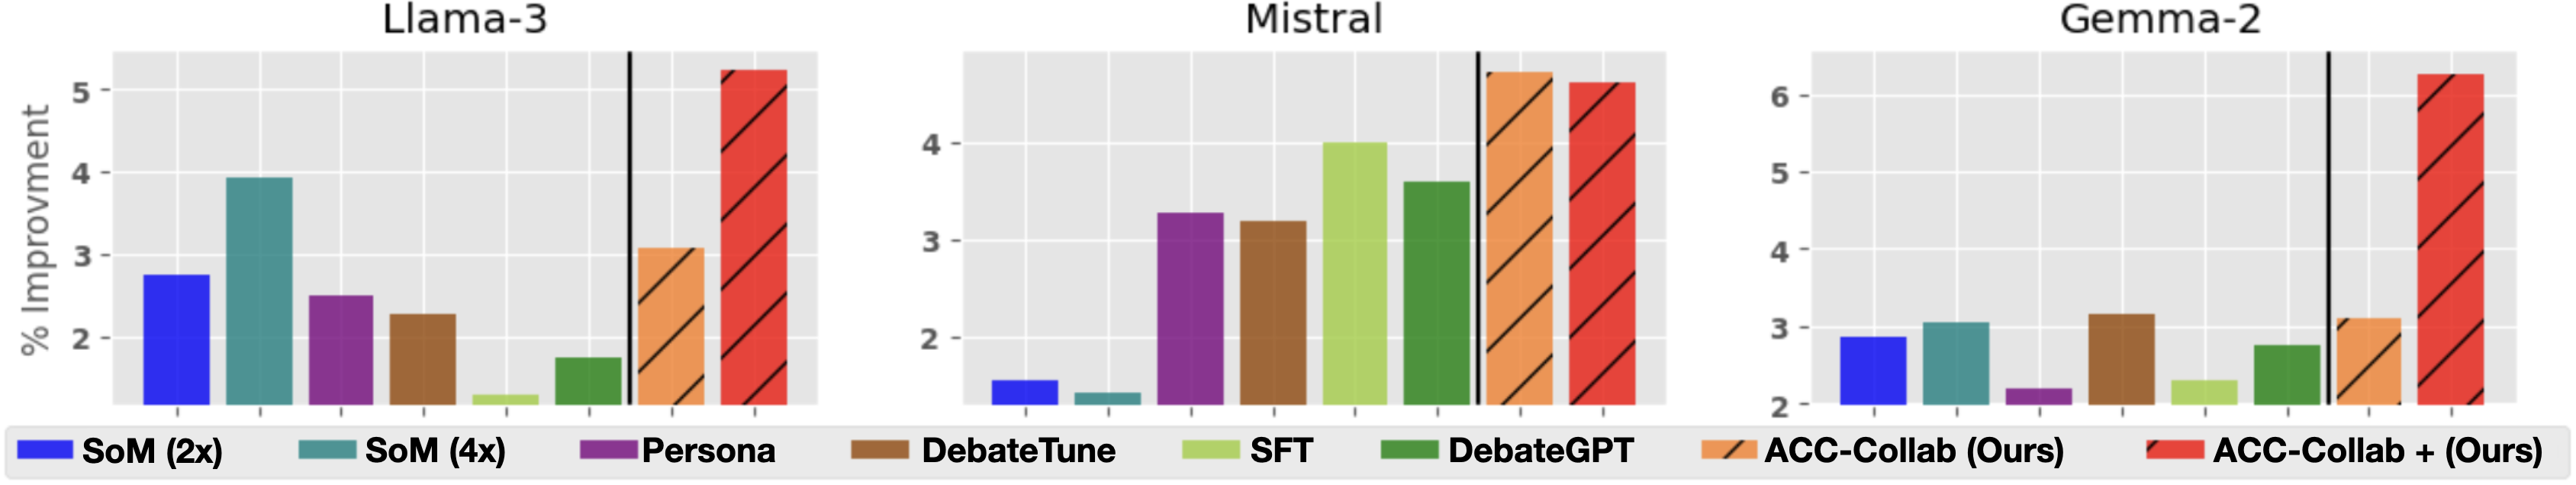
The image displays a set of three bar charts arranged horizontally, comparing the percentage improvement of eight different methods or models across three base language models: Llama-3, Mistral, and Gemma-2. The charts share a common legend and y-axis label.
### Components/Axes
* **Main Title:** Not present as a single overarching title. Each subplot has its own title: "Llama-3", "Mistral", "Gemma-2".
* **Y-Axis:** Labeled "% Improvement". The scale varies by subplot:
* Llama-3: 0 to 5 (ticks at 2, 3, 4, 5).
* Mistral: 0 to 4 (ticks at 2, 3, 4).
* Gemma-2: 0 to 6 (ticks at 2, 3, 4, 5, 6).
* **X-Axis:** Represents categorical methods. No individual labels are present on the axis; identification is via the legend.
* **Legend:** Located at the bottom of the image, spanning its full width. It defines eight distinct series:
1. **SoM (2x):** Solid blue bar.
2. **SoM (4x):** Solid teal bar.
3. **Persona:** Solid purple bar.
4. **DebateTune:** Solid brown bar.
5. **SFT:** Solid light green bar.
6. **DebateGPT:** Solid dark green bar.
7. **ACC-Collab (Ours):** Orange bar with diagonal hatching (\\).
8. **ACC-Collab + (Ours):** Red bar with diagonal hatching (\\).
* **Visual Separator:** A vertical black line appears in each subplot, separating the first six methods from the last two ("ACC-Collab" variants).
### Detailed Analysis
**Llama-3 Chart (Left):**
* **Trend:** Performance varies significantly. The two "ACC-Collab" methods are the highest, with "ACC-Collab + (Ours)" being the tallest bar overall.
* **Approximate Values (from visual estimation):**
* SoM (2x): ~2.8%
* SoM (4x): ~3.9%
* Persona: ~2.5%
* DebateTune: ~2.3%
* SFT: ~1.2% (lowest)
* DebateGPT: ~1.8%
* ACC-Collab (Ours): ~3.1%
* ACC-Collab + (Ours): ~5.2% (highest)
**Mistral Chart (Center):**
* **Trend:** The "ACC-Collab" methods again show the highest improvement, with "ACC-Collab (Ours)" slightly leading. The "SoM" methods show very low improvement.
* **Approximate Values:**
* SoM (2x): ~1.5%
* SoM (4x): ~1.3% (lowest)
* Persona: ~3.3%
* DebateTune: ~3.2%
* SFT: ~4.0%
* DebateGPT: ~3.6%
* ACC-Collab (Ours): ~4.3% (highest)
* ACC-Collab + (Ours): ~4.2%
**Gemma-2 Chart (Right):**
* **Trend:** "ACC-Collab + (Ours)" shows a dramatic and dominant lead over all other methods. Most other methods cluster between 2-3% improvement.
* **Approximate Values:**
* SoM (2x): ~2.9%
* SoM (4x): ~3.1%
* Persona: ~2.2% (lowest)
* DebateTune: ~3.2%
* SFT: ~2.3%
* DebateGPT: ~2.8%
* ACC-Collab (Ours): ~3.1%
* ACC-Collab + (Ours): ~6.3% (highest, by a large margin)
### Key Observations
1. **Consistent Top Performers:** The two methods labeled "(Ours)"—ACC-Collab and ACC-Collab +—are consistently among the top performers across all three base models.
2. **Model-Specific Variability:** The relative performance of other methods (e.g., SFT, Persona) varies notably between models. For instance, SFT is the lowest on Llama-3 but one of the higher non-"Ours" methods on Mistral.
3. **Dramatic Outlier:** The performance of "ACC-Collab + (Ours)" on Gemma-2 is a significant outlier, showing an improvement percentage nearly double that of the next best method on that same model.
4. **SoM Performance:** The "SoM" methods show inconsistent results, performing relatively well on Llama-3 and Gemma-2 but very poorly on Mistral.
### Interpretation
This chart presents a comparative evaluation, likely from a research paper, where the authors are benchmarking their proposed methods ("ACC-Collab" and "ACC-Collab +") against several existing techniques (SoM, Persona, DebateTune, SFT, DebateGPT). The data strongly suggests that the authors' methods provide superior or highly competitive improvements in the measured metric (likely accuracy or a related performance score) across diverse underlying language models.
The vertical black line visually segregates the authors' contributions from prior work, emphasizing their comparison. The exceptional result for "ACC-Collab + (Ours)" on Gemma-2 indicates a particularly strong synergy between that specific method and the Gemma-2 model architecture or its training data. The variability in other methods' rankings underscores that no single technique is universally optimal; performance is model-dependent. The chart's primary purpose is to demonstrate the efficacy and robustness of the "ACC-Collab" family of methods.