## Bar Chart: Model Performance Comparison Across Datasets
### Overview
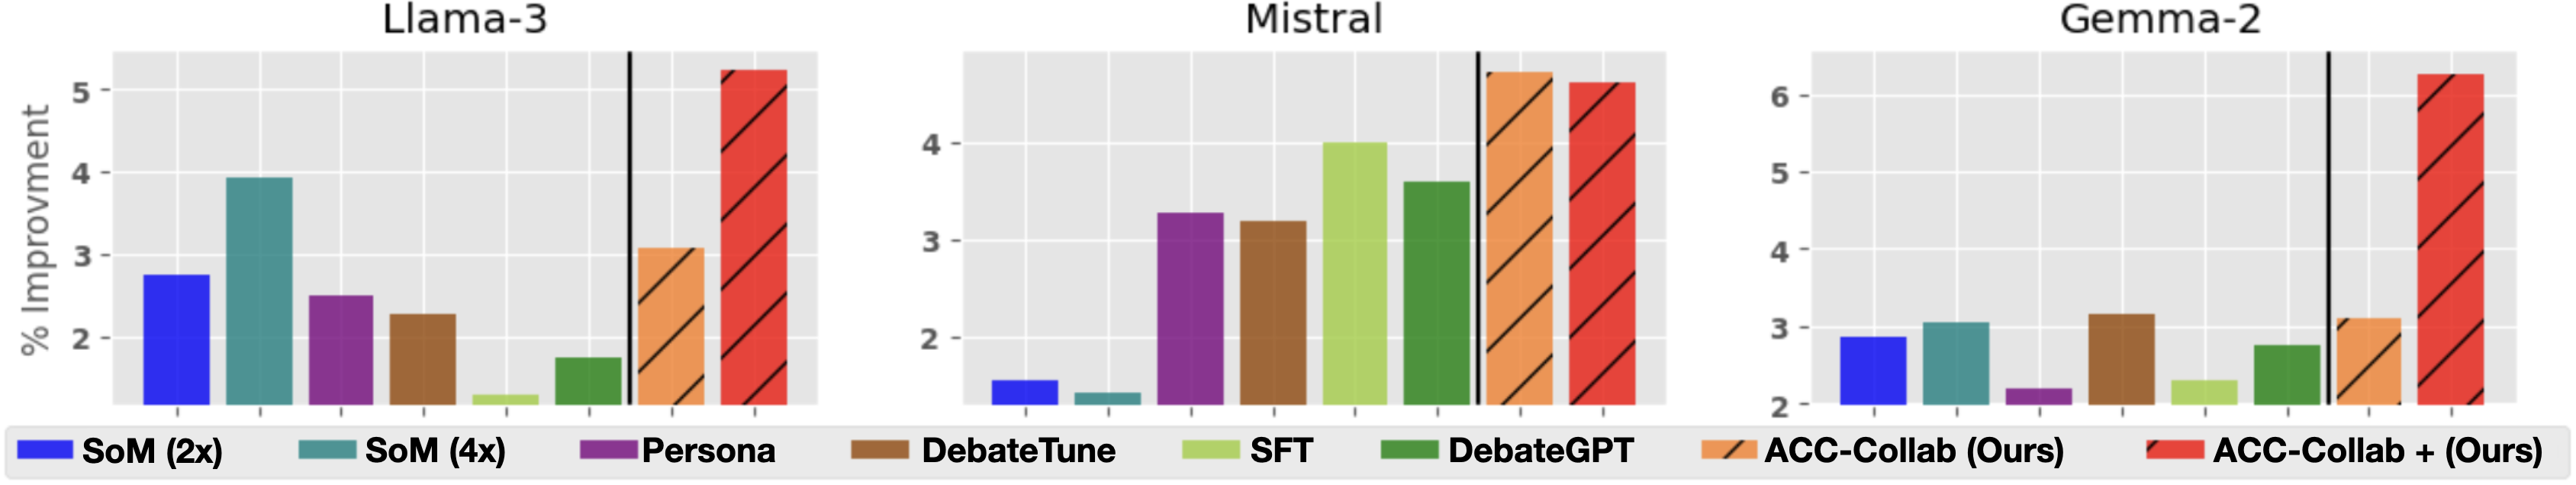
The image presents three grouped bar charts comparing the percentage improvement of various AI models across three datasets: **Llama-3**, **Mistral**, and **Gemma-2**. Each chart includes multiple models, with performance metrics represented as vertical bars. The y-axis measures "% Improvement" (0–6), and the x-axis lists the datasets. A legend at the bottom maps colors to model names.
### Components/Axes
- **X-axis**: Datasets (**Llama-3**, **Mistral**, **Gemma-2**).
- **Y-axis**: "% Improvement" (0–6, with gridlines at 1–5).
- **Legend**: Located at the bottom, with colors corresponding to:
- **SoM (2x)**: Blue
- **SoM (4x)**: Teal
- **Persona**: Purple
- **DebateTune**: Brown
- **SFT**: Light green
- **DebateGPT**: Dark green
- **ACC-Collab (Ours)**: Orange with diagonal stripes
- **ACC-Collab + (Ours)**: Red with diagonal stripes
### Detailed Analysis
#### Llama-3 Dataset
- **SoM (4x)**: ~4.0% improvement (teal bar).
- **Persona**: ~2.5% improvement (purple bar).
- **DebateTune**: ~2.3% improvement (brown bar).
- **ACC-Collab (Ours)**: ~3.1% improvement (orange striped bar).
- **ACC-Collab + (Ours)**: ~5.3% improvement (red striped bar).
#### Mistral Dataset
- **SFT**: ~4.0% improvement (light green bar).
- **DebateGPT**: ~3.8% improvement (dark green bar).
- **ACC-Collab (Ours)**: ~5.2% improvement (orange striped bar).
- **ACC-Collab + (Ours)**: ~5.1% improvement (red striped bar).
#### Gemma-2 Dataset
- **SoM (2x)**: ~2.0% improvement (blue bar).
- **DebateTune**: ~2.3% improvement (brown bar).
- **ACC-Collab (Ours)**: ~3.2% improvement (orange striped bar).
- **ACC-Collab + (Ours)**: ~6.2% improvement (red striped bar).
### Key Observations
1. **ACC-Collab + (Ours)** consistently achieves the highest improvement across all datasets, with values ranging from **5.1% (Mistral)** to **6.2% (Gemma-2)**.
2. **SoM (4x)** shows strong performance in **Llama-3** (~4.0%) but underperforms in **Mistral** (~0.5%) and **Gemma-2** (~1.8%).
3. **SFT** achieves the highest improvement in **Mistral** (~4.0%) but is the lowest-performing model in **Llama-3** (~0.5%).
4. **ACC-Collab (Ours)** performs moderately well, with improvements between **3.1% (Llama-3)** and **5.2% (Mistral)**.
### Interpretation
The data suggests that **ACC-Collab + (Ours)** is the most effective method overall, outperforming all other models by a significant margin. This implies that combining **ACC-Collab** with additional techniques (denoted by "+ (Ours)") enhances performance. **SoM (4x)** is highly effective for **Llama-3** but less so for other datasets, indicating dataset-specific dependencies. **SFT** excels in **Mistral** but struggles in **Llama-3**, highlighting variability in model efficacy across tasks. The consistent dominance of **ACC-Collab + (Ours)** underscores its potential as a robust solution for improving model performance.
### Spatial Grounding & Trend Verification
- **Legend**: Positioned at the bottom, with colors matching the bars exactly.
- **Trends**:
- **ACC-Collab + (Ours)** slopes upward across all datasets.
- **SoM (4x)** peaks in **Llama-3** but declines in others.
- **SFT** peaks in **Mistral** but is minimal in **Llama-3**.
- **Outliers**: **ACC-Collab + (Ours)** in **Gemma-2** (6.2%) is the highest value, while **SFT** in **Llama-3** (0.5%) is the lowest.
### Final Notes
The chart emphasizes the importance of method selection based on dataset characteristics. **ACC-Collab + (Ours)** emerges as a universally strong performer, while other models exhibit dataset-specific strengths and weaknesses. Further investigation into the underlying mechanisms of **ACC-Collab + (Ours)** could reveal insights for optimizing AI model training.