## Line Chart: Model Accuracy vs. Max Allowed Turns
### Overview
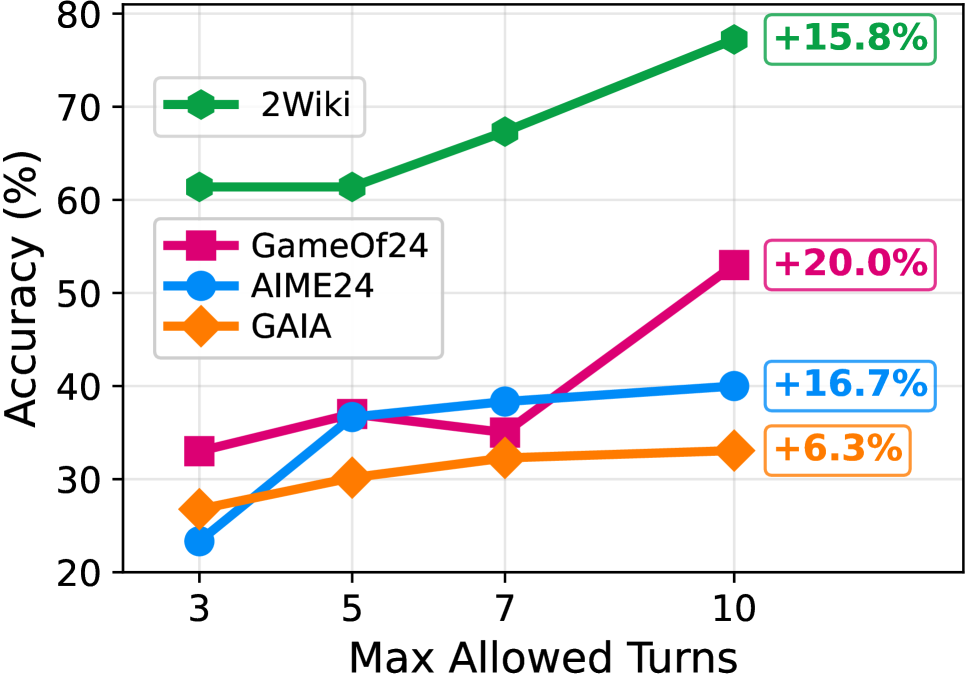
The chart compares the accuracy (%) of three models (2Wiki, GameOf24, AIME24) across increasing "Max Allowed Turns" (3, 5, 7, 10). A fourth model (GAIA) is referenced in the legend but not plotted. Accuracy values are annotated with percentage increases relative to the starting point (3 turns).
### Components/Axes
- **X-axis**: Max Allowed Turns (3, 5, 7, 10)
- **Y-axis**: Accuracy (%) (20–80 range)
- **Legend**:
- 2Wiki (green line with diamond markers)
- GameOf24 (pink line with square markers)
- AIME24 (blue line with circle markers)
- GAIA (orange line with diamond markers, **not plotted**)
- **Annotations**:
- "+15.8%" (2Wiki, 10 turns)
- "+20.0%" (GameOf24, 10 turns)
- "+16.7%" (AIME24, 10 turns)
- "+6.3%" (GAIA, 10 turns)
### Detailed Analysis
1. **2Wiki (Green)**:
- Starts at **60%** (3 turns), remains flat at 60% for 5 turns.
- Increases to **67%** at 7 turns, then sharply rises to **77%** at 10 turns (+15.8% from baseline).
- **Trend**: Steady growth after 5 turns.
2. **GameOf24 (Pink)**:
- Begins at **33%** (3 turns), rises to **35%** at 5 turns.
- Drops slightly to **34%** at 7 turns, then surges to **53%** at 10 turns (+20.0% from baseline).
- **Trend**: Sharp acceleration after 7 turns.
3. **AIME24 (Blue)**:
- Starts at **23%** (3 turns), climbs to **37%** at 5 turns.
- Increases to **39%** at 7 turns, then plateaus at **40%** at 10 turns (+16.7% from baseline).
- **Trend**: Gradual improvement with diminishing returns.
4. **GAIA (Orange, Not Plotted)**:
- Legend indicates a "+6.3%" increase at 10 turns, but no data points are visible.
- **Possible Explanation**: Data omission, error, or model underperformance.
### Key Observations
- **2Wiki** achieves the highest accuracy (77% at 10 turns) and shows the most consistent growth.
- **GameOf24** exhibits the steepest improvement (+20%) but starts with lower baseline accuracy.
- **AIME24** demonstrates moderate gains but lags behind others at higher turn counts.
- **GAIA**’s absence from the chart raises questions about data completeness or model efficacy.
### Interpretation
The data suggests that **2Wiki** scales most effectively with increased computational effort (turns), while **GameOf24**’s dramatic late-stage jump may indicate a threshold effect (e.g., solving complex problems after a critical number of steps). **AIME24**’s plateau at 10 turns implies diminishing returns. The exclusion of GAIA from the plotted data warrants further investigation—its "+6.3%" annotation suggests it underperforms relative to the others. The chart highlights trade-offs between model design and scalability, with 2Wiki emerging as the most robust performer.