# Technical Document Extraction: Accuracy vs. Target Axis Chart
## Chart Type
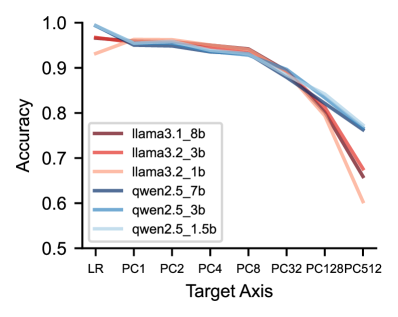
Line chart comparing model accuracy across different target axes.
## Axis Labels
- **Y-Axis**: Accuracy (0.5 to 1.0)
- **X-Axis**: Target Axis (LR, PC1, PC2, PC4, PC8, PC32, PC128PC512)
## Legend Entries (Model Configurations)
1. **llama3.1_8b** (Dark Red)
2. **llama3.2_3b** (Red)
3. **llama3.2_1b** (Light Orange)
4. **qwen2.5_7b** (Dark Blue)
5. **qwen2.5_3b** (Blue)
6. **qwen2.5_1.5b** (Light Blue)
## Key Trends
1. **Initial Performance**:
- All models start near **0.95 accuracy** at the "LR" (Left) axis.
- Lines are tightly clustered, indicating similar baseline performance.
2. **Decline Pattern**:
- Accuracy decreases gradually as target axis progresses from LR → PC128PC512.
- Steeper decline observed after **PC32**, with all lines converging toward ~0.7 accuracy by PC128PC512.
3. **Model-Specific Behavior**:
- **llama3.1_8b** (dark red) and **qwen2.5_7b** (dark blue) maintain slightly higher accuracy than smaller models (e.g., llama3.2_1b, qwen2.5_1.5b) in later axes.
- **llama3.2_3b** (red) and **qwen2.5_3b** (blue) show intermediate performance.
4. **Convergence**:
- By PC128PC512, all models exhibit overlapping accuracy (~0.65–0.7), suggesting diminishing returns with increased axis complexity.
## Notes
- No explicit data points are labeled; trends are inferred from line trajectories.
- Axis labels use a mix of "LR" (likely "Left/Right") and "PC" (Principal Component) notation, with PC values increasing exponentially (e.g., PC1 → PC128PC512).
- Legend colors are consistently mapped to model configurations across the chart.