## Line Graph: response_length/mean
### Overview
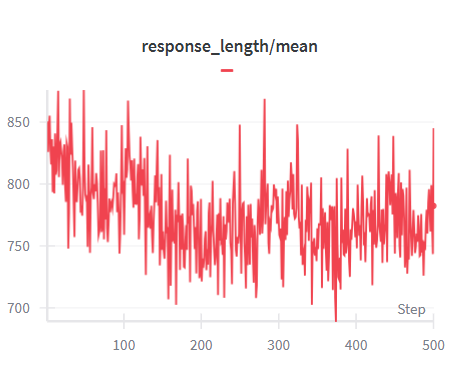
The image is a line graph depicting the relationship between "Step" (x-axis) and "response_length/mean" (y-axis). The red line fluctuates significantly across the x-axis range (100–500), with no clear linear trend. The y-axis values range approximately from 700 to 850, with sharp peaks and troughs.
### Components/Axes
- **Title**: "response_length/mean" (centered at the top).
- **X-axis**: Labeled "Step", with numerical markers at 100, 200, 300, 400, and 500. The axis spans from 0 to 500.
- **Y-axis**: Labeled "response_length/mean", with numerical markers at 700, 750, 800, and 850. The axis spans from 700 to 850.
- **Legend**: A red line is labeled "response_length/mean" (positioned near the top of the graph, adjacent to the title).
- **Line**: A single red line with high variability, oscillating between 700 and 850.
### Detailed Analysis
- **X-axis (Step)**: The horizontal axis represents sequential steps, incrementing by 100. The line spans the entire range (100–500).
- **Y-axis (response_length/mean)**: The vertical axis measures the mean response length, with values fluctuating between 700 and 850. The line exhibits sharp upward and downward spikes, indicating high variability.
- **Line Behavior**: The red line shows no consistent upward or downward trend. It alternates between peaks (near 850) and troughs (near 700), with no discernible pattern in the fluctuations.
### Key Observations
- **High Variability**: The response length/mean fluctuates dramatically, with no stable baseline or trend.
- **Peaks and Troughs**: The line reaches maximum values (~850) and minimum values (~700) repeatedly, suggesting inconsistent behavior.
- **No Correlation**: There is no apparent relationship between the "Step" values and the response length/mean, as the line does not follow a predictable trajectory.
### Interpretation
The data suggests that the mean response length is highly variable across the observed steps, indicating potential instability or external factors influencing the response. The lack of a clear trend implies that the system or process being measured does not exhibit consistent behavior over time. This could point to issues such as:
- **Unpredictable Inputs**: Variability in the data being processed.
- **System Instability**: Fluctuations in response times due to resource constraints or errors.
- **External Influences**: External variables (e.g., user behavior, environmental factors) affecting the response length.
The graph highlights the need for further investigation into the root causes of the variability, as the mean response length does not stabilize, which could impact performance metrics or user experience.