\n
## Line Chart: Response Length / Mean
### Overview
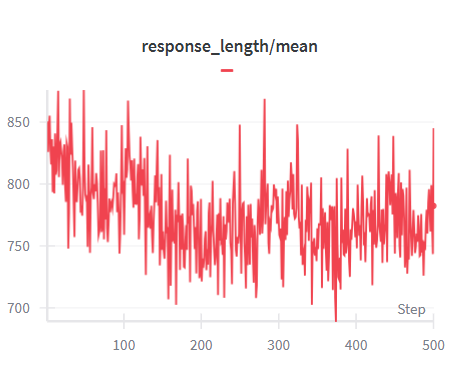
The image presents a line chart illustrating the relationship between "response_length" and "mean" over a series of "Steps". The chart displays a fluctuating line, indicating changes in response length relative to the mean as the step number increases.
### Components/Axes
* **Title:** "response\_length/mean" positioned at the top-center of the chart.
* **X-axis:** Labeled "Step", ranging from approximately 0 to 500. The axis is linear.
* **Y-axis:** The scale ranges from approximately 700 to 850. The axis represents the value of "response\_length/mean".
* **Data Series:** A single line, colored red, representing the "response\_length/mean" values.
* **Gridlines:** Horizontal gridlines are present to aid in reading values.
### Detailed Analysis
The red line representing "response\_length/mean" begins at approximately 840 at Step 0. The line generally slopes downward from Step 0 to approximately Step 300, with significant fluctuations. From Step 300 to Step 500, the line continues to fluctuate, but appears to stabilize around a value of approximately 770-790.
Here's a breakdown of approximate values at specific steps:
* Step 0: ~840
* Step 50: ~820
* Step 100: ~800
* Step 150: ~790
* Step 200: ~770
* Step 250: ~750
* Step 300: ~740
* Step 350: ~760
* Step 400: ~770
* Step 450: ~780
* Step 500: ~785
The line exhibits high volatility throughout the entire range of steps, with frequent peaks and troughs. The amplitude of these fluctuations appears to decrease slightly after Step 300, but remains substantial.
### Key Observations
* **Downward Trend:** There is a general downward trend in "response\_length/mean" from Step 0 to Step 300.
* **Stabilization:** After Step 300, the line appears to stabilize, fluctuating within a narrower range.
* **High Volatility:** The data exhibits significant volatility throughout the entire range of steps.
* **No Clear Cyclicity:** While there are fluctuations, there is no immediately obvious cyclical pattern.
### Interpretation
The chart suggests that the average response length, relative to some mean value, decreases over the first 300 steps. After this initial decrease, the response length stabilizes, but continues to fluctuate. The high volatility indicates that the response length is sensitive to changes at each step.
The initial decrease could be due to a learning process, where the system is becoming more efficient at generating responses. The stabilization after Step 300 could indicate that the system has reached a steady state. The continued fluctuations suggest that there are still factors influencing the response length, even after the system has stabilized.
Without further context, it is difficult to determine the specific meaning of "response\_length" and "Step". However, the chart provides valuable insights into the behavior of the system over time. It would be useful to investigate the factors that contribute to the volatility and to understand why the response length decreases initially.