## Bar Chart: Model Performance Comparison
### Overview
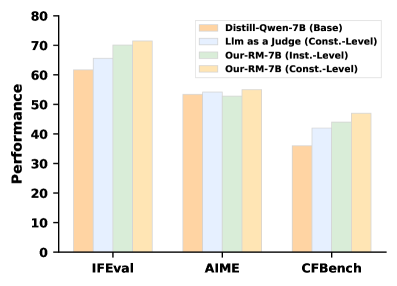
The image is a bar chart comparing the performance of four different models (Distill-Qwen-7B, Llm as a Judge, Our-RM-7B (Inst.-Level), and Our-RM-7B (Const.-Level)) across three evaluation benchmarks (IFEval, AIME, and CFBench). The y-axis represents performance, ranging from 0 to 80.
### Components/Axes
* **X-axis:** Evaluation benchmarks: IFEval, AIME, CFBench
* **Y-axis:** Performance, with a scale from 0 to 80 in increments of 10.
* **Legend (Top-Right):**
* Orange: Distill-Qwen-7B (Base)
* Light Blue: Llm as a Judge (Const.-Level)
* Light Green: Our-RM-7B (Inst.-Level)
* Light Yellow: Our-RM-7B (Const.-Level)
### Detailed Analysis
**IFEval Benchmark:**
* Distill-Qwen-7B (Base) (Orange): Approximately 62
* Llm as a Judge (Const.-Level) (Light Blue): Approximately 66
* Our-RM-7B (Inst.-Level) (Light Green): Approximately 70
* Our-RM-7B (Const.-Level) (Light Yellow): Approximately 72
**AIME Benchmark:**
* Distill-Qwen-7B (Base) (Orange): Approximately 54
* Llm as a Judge (Const.-Level) (Light Blue): Approximately 55
* Our-RM-7B (Inst.-Level) (Light Green): Approximately 53
* Our-RM-7B (Const.-Level) (Light Yellow): Approximately 56
**CFBench Benchmark:**
* Distill-Qwen-7B (Base) (Orange): Approximately 36
* Llm as a Judge (Const.-Level) (Light Blue): Approximately 42
* Our-RM-7B (Inst.-Level) (Light Green): Approximately 44
* Our-RM-7B (Const.-Level) (Light Yellow): Approximately 47
### Key Observations
* Across all benchmarks, Our-RM-7B (Const.-Level) generally shows the highest performance.
* Distill-Qwen-7B (Base) consistently shows the lowest performance among the four models.
* The performance difference between the models is most pronounced in the IFEval benchmark.
* All models perform worst on the CFBench benchmark.
### Interpretation
The bar chart provides a comparative analysis of the performance of four language models across three different evaluation benchmarks. The data suggests that the "Our-RM-7B (Const.-Level)" model generally outperforms the other models, while "Distill-Qwen-7B (Base)" model generally underperforms. The varying performance across different benchmarks indicates that the models have different strengths and weaknesses depending on the type of evaluation. The IFEval benchmark seems to be the most discriminating, showing the largest performance differences between the models. The CFBench benchmark appears to be the most challenging for all models.