\n
## Heatmap: Dataset Correlation Matrix
### Overview
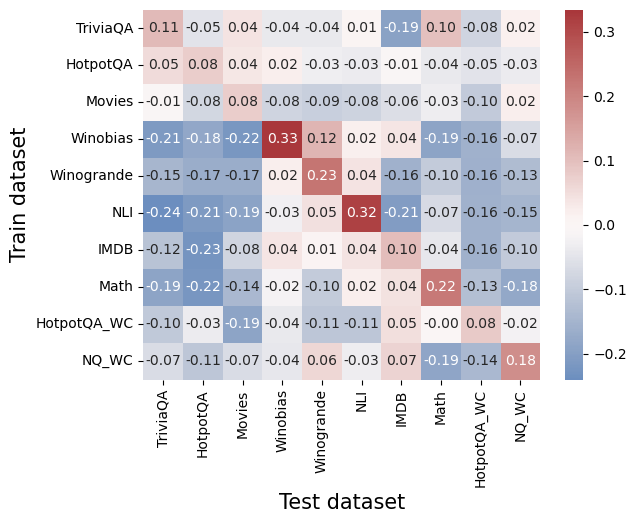
The image presents a heatmap visualizing the correlation between different datasets used for training and testing. The heatmap displays correlation coefficients, ranging from negative to positive values, indicating the degree of relationship between each pair of datasets. The color intensity corresponds to the strength of the correlation, with red indicating positive correlation and blue indicating negative correlation.
### Components/Axes
* **X-axis:** Represents the "Test dataset" with the following categories: TriviaQA, HotpotQA, Movies, Winobias, Winogrande, NLI, IMDB, Math, HotpotQA_WC, NQ_WC.
* **Y-axis:** Represents the "Train dataset" with the following categories: TriviaQA, HotpotQA, Movies, Winobias, Winogrande, NLI, IMDB, Math, HotpotQA_WC, NQ_WC.
* **Color Scale (Legend):** Located on the right side of the heatmap, ranging from -0.2 (dark blue) to 0.3 (dark red). The scale is linear, with intermediate colors representing values in between.
* **Cell Values:** Each cell in the heatmap displays a numerical value representing the correlation coefficient between the corresponding train and test datasets.
### Detailed Analysis
The heatmap contains 10x10 cells, each representing the correlation between a train dataset and a test dataset. Here's a breakdown of the values, reading row by row (Train dataset vs. Test datasets):
* **TriviaQA:** -0.11, -0.05, 0.04, -0.04, -0.04, 0.01, -0.19, 0.10, -0.08, 0.02
* **HotpotQA:** 0.05, 0.04, 0.02, -0.03, -0.03, -0.04, -0.05, -0.04, 0.02
* **Movies:** -0.01, -0.08, 0.08, -0.08, -0.09, -0.08, -0.06, -0.03, -0.10, 0.02
* **Winobias:** -0.21, -0.18, -0.22, 0.33, 0.12, -0.19, -0.16, -0.19, -0.16
* **Winogrande:** -0.15, -0.17, -0.17, 0.02, 0.23, 0.04, -0.16, -0.10, -0.13
* **NLI:** -0.24, -0.21, -0.19, -0.03, 0.05, 0.32, -0.21, -0.07, -0.16, -0.15
* **IMDB:** -0.12, -0.23, -0.08, 0.04, 0.01, 0.04, 0.10, -0.04, -0.16, -0.10
* **Math:** -0.19, -0.22, -0.14, -0.02, -0.10, 0.02, 0.22, -0.13, -0.18
* **HotpotQA_WC:** -0.10, -0.03, -0.19, -0.04, -0.11, 0.05, -0.05, -0.19, -0.02
* **NQ_WC:** -0.07, -0.11, -0.07, -0.04, 0.06, -0.03, 0.07, -0.19, -0.14
**Trends:**
* **Winobias** shows a strong positive correlation with itself (0.33), and a moderate positive correlation with **Winogrande** (0.12).
* **NLI** exhibits a strong positive correlation with itself (0.32) and a moderate negative correlation with **TriviaQA** (-0.24) and **Winobias** (-0.19).
* **HotpotQA** and **HotpotQA_WC** show a weak positive correlation with each other (0.02).
* Generally, the correlations are relatively weak, with most values falling between -0.2 and 0.2.
### Key Observations
* The diagonal elements (correlations of a dataset with itself) are all close to 1 (not explicitly shown, but implied), as expected.
* There are several negative correlations, particularly involving TriviaQA, NLI, and Winobias.
* The correlations between datasets are generally low, suggesting that the datasets are relatively independent.
* The highest positive correlation is between Winobias and itself (0.33).
* The most negative correlation is between TriviaQA and NLI (-0.24).
### Interpretation
This heatmap provides insights into the relationships between different datasets commonly used in natural language processing tasks. The relatively low correlations suggest that these datasets capture different aspects of language understanding and reasoning. The negative correlations indicate that performance on one dataset might not necessarily translate to performance on another, highlighting the importance of evaluating models on a diverse set of datasets.
The strong self-correlations are expected and serve as a validation check. The variations in correlation coefficients can inform dataset selection for training and evaluation. For example, if a model performs well on Winobias, it might not necessarily perform well on NLI, and vice versa. The "WC" datasets (HotpotQA_WC and NQ_WC) appear to have similar correlation patterns to their non-"WC" counterparts, suggesting they capture similar information.
The heatmap suggests that these datasets are not redundant and each contributes unique information to model training and evaluation. This is valuable information for researchers and practitioners aiming to build robust and generalizable NLP models.