## Heatmap: Correlation Between Train and Test Datasets
### Overview
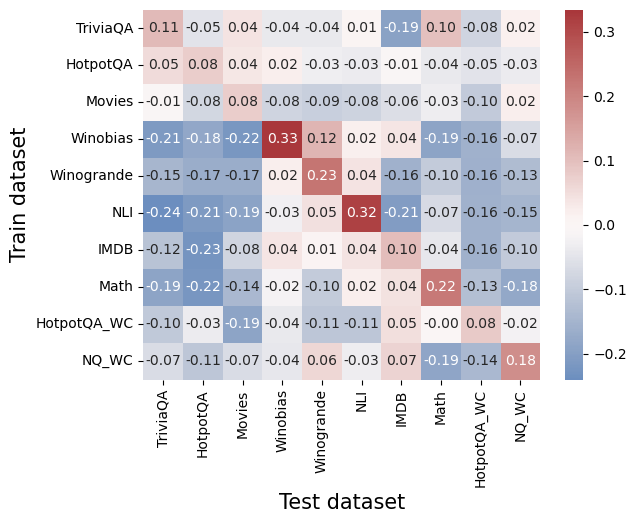
This heatmap visualizes the correlation coefficients between different question-answering (QA) datasets when used as training and test sets. Values range from -0.3 (strong negative correlation) to +0.3 (strong positive correlation), with a color gradient from blue (negative) to red (positive).
### Components/Axes
- **X-axis (Test datasets)**: TriviaQA, HotpotQA, Movies, Winobias, Winogrande, NLI, IMDB, Math, HotpotQA_WC, NQ_WC
- **Y-axis (Train datasets)**: Same as X-axis, listed vertically
- **Color legend**: Blue (-0.3 to -0.1), white (0), red (+0.1 to +0.3)
- **Numerical values**: Embedded in each cell, representing Pearson correlation coefficients
### Detailed Analysis
1. **Diagonal dominance**:
- Highest positive correlations occur when train and test datasets match:
- Winobias: 0.33 (darkest red)
- NLI: 0.32
- Math: 0.22
- These values confirm that models trained on a dataset perform best on the same dataset.
2. **Cross-dataset correlations**:
- **Negative correlations**:
- TriviaQA trained on Winobias: -0.21 (darkest blue)
- HotpotQA trained on Movies: -0.08
- NLI trained on Winogrande: -0.17
- **Positive cross-correlations**:
- Math trained on Winobias: 0.22
- NQ_WC trained on HotpotQA_WC: 0.18
3. **Notable patterns**:
- **Winobias** shows strong negative correlations with most datasets when used as a test set (e.g., -0.18 with TriviaQA, -0.16 with Winogrande).
- **Math** exhibits moderate positive correlations with multiple datasets (e.g., 0.10 with IMDB, 0.04 with Movies).
- **HotpotQA_WC** and **NQ_WC** show mixed performance, with some negative correlations (e.g., -0.19 with Math) and positive ones (e.g., 0.18 for NQ_WC).
### Key Observations
- **Same-dataset training/test**: Consistently yields the highest correlations (0.22–0.33).
- **Cross-dataset performance**: Varies widely, with some datasets (e.g., Math) showing broader utility, while others (e.g., Winobias) struggle to generalize.
- **Strongest negative correlation**: TriviaQA trained on Winobias (-0.21), suggesting poor transferability.
### Interpretation
The heatmap reveals that QA models trained on specific datasets (e.g., Winobias, NLI) perform best on the same datasets, highlighting dataset-specific knowledge encoding. Cross-dataset correlations are mixed, indicating limited generalization for some datasets (e.g., Winobias) but moderate transferability for others (e.g., Math). The strongest negative correlation (-0.21) suggests that training on Winobias may introduce biases or patterns that conflict with TriviaQA, potentially harming performance. This underscores the importance of dataset selection for model robustness and the need for diverse training data to improve generalization.