## Line Graph: Step Value Fluctuations Over Time
### Overview
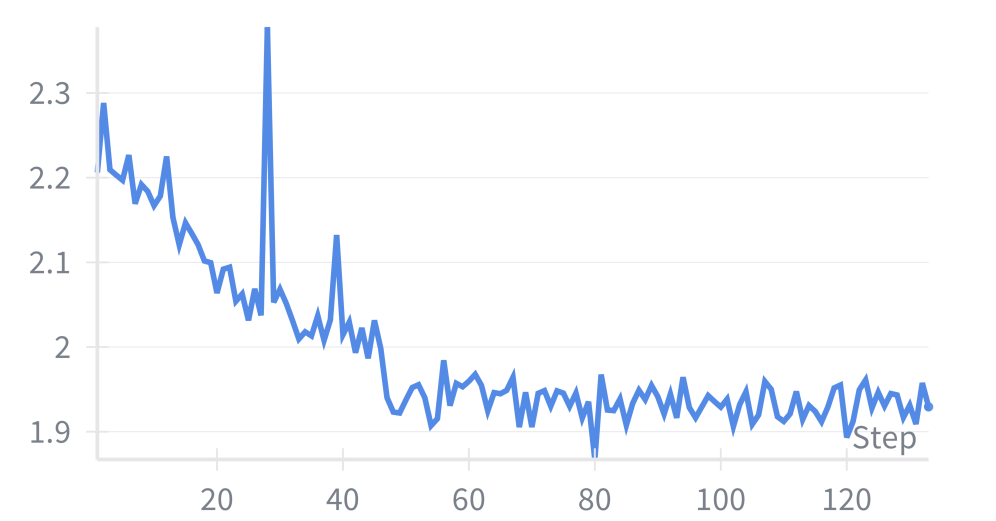
The image depicts a line graph illustrating the fluctuations of a metric labeled "Step" over a sequential x-axis (0–120). The y-axis represents numerical values ranging from 1.9 to 2.3. The blue line exhibits significant volatility, with a pronounced spike near step 25 and a general downward trend thereafter.
### Components/Axes
- **X-Axis (Horizontal)**: Labeled "Step," with increments marked at 0, 20, 40, 60, 80, 100, and 120.
- **Y-Axis (Vertical)**: Unlabeled but scaled from 1.9 to 2.3 in increments of 0.1.
- **Legend**: Positioned at the bottom-right corner, labeled "Step" with a blue line indicator.
- **Line**: A single blue line with markers, representing the data series.
### Detailed Analysis
- **Initial Trend (Steps 0–25)**:
- Starts at approximately **2.3** at step 0.
- Gradually declines to ~2.15 by step 20.
- Sharp upward spike to **~2.35** at step 25, the highest point on the graph.
- **Post-Spike Trend (Steps 25–120)**:
- Rapid decline to ~2.0 by step 40.
- Continued downward trajectory with minor fluctuations, reaching a trough of **~1.9** near step 80.
- Stabilizes around **1.9–2.0** from steps 80–120, with slight oscillations.
### Key Observations
1. **Anomaly at Step 25**: The sharp spike (~2.35) deviates significantly from the surrounding trend, suggesting an outlier or event.
2. **General Decline**: After the spike, the metric trends downward, stabilizing near 1.9–2.0 by the end of the dataset.
3. **Volatility**: Minor fluctuations persist throughout, indicating variability in the measured metric.
### Interpretation
The graph suggests a dynamic system where the "Step" metric experiences a temporary surge at step 25, followed by a sustained decline. The spike could represent an external intervention, measurement error, or a transient event. The subsequent stabilization implies a return to baseline behavior. The volatility highlights inherent instability in the system, warranting further investigation into the cause of the spike and the factors influencing the long-term decline.
**Note**: All values are approximate due to the absence of explicit data labels on the line.