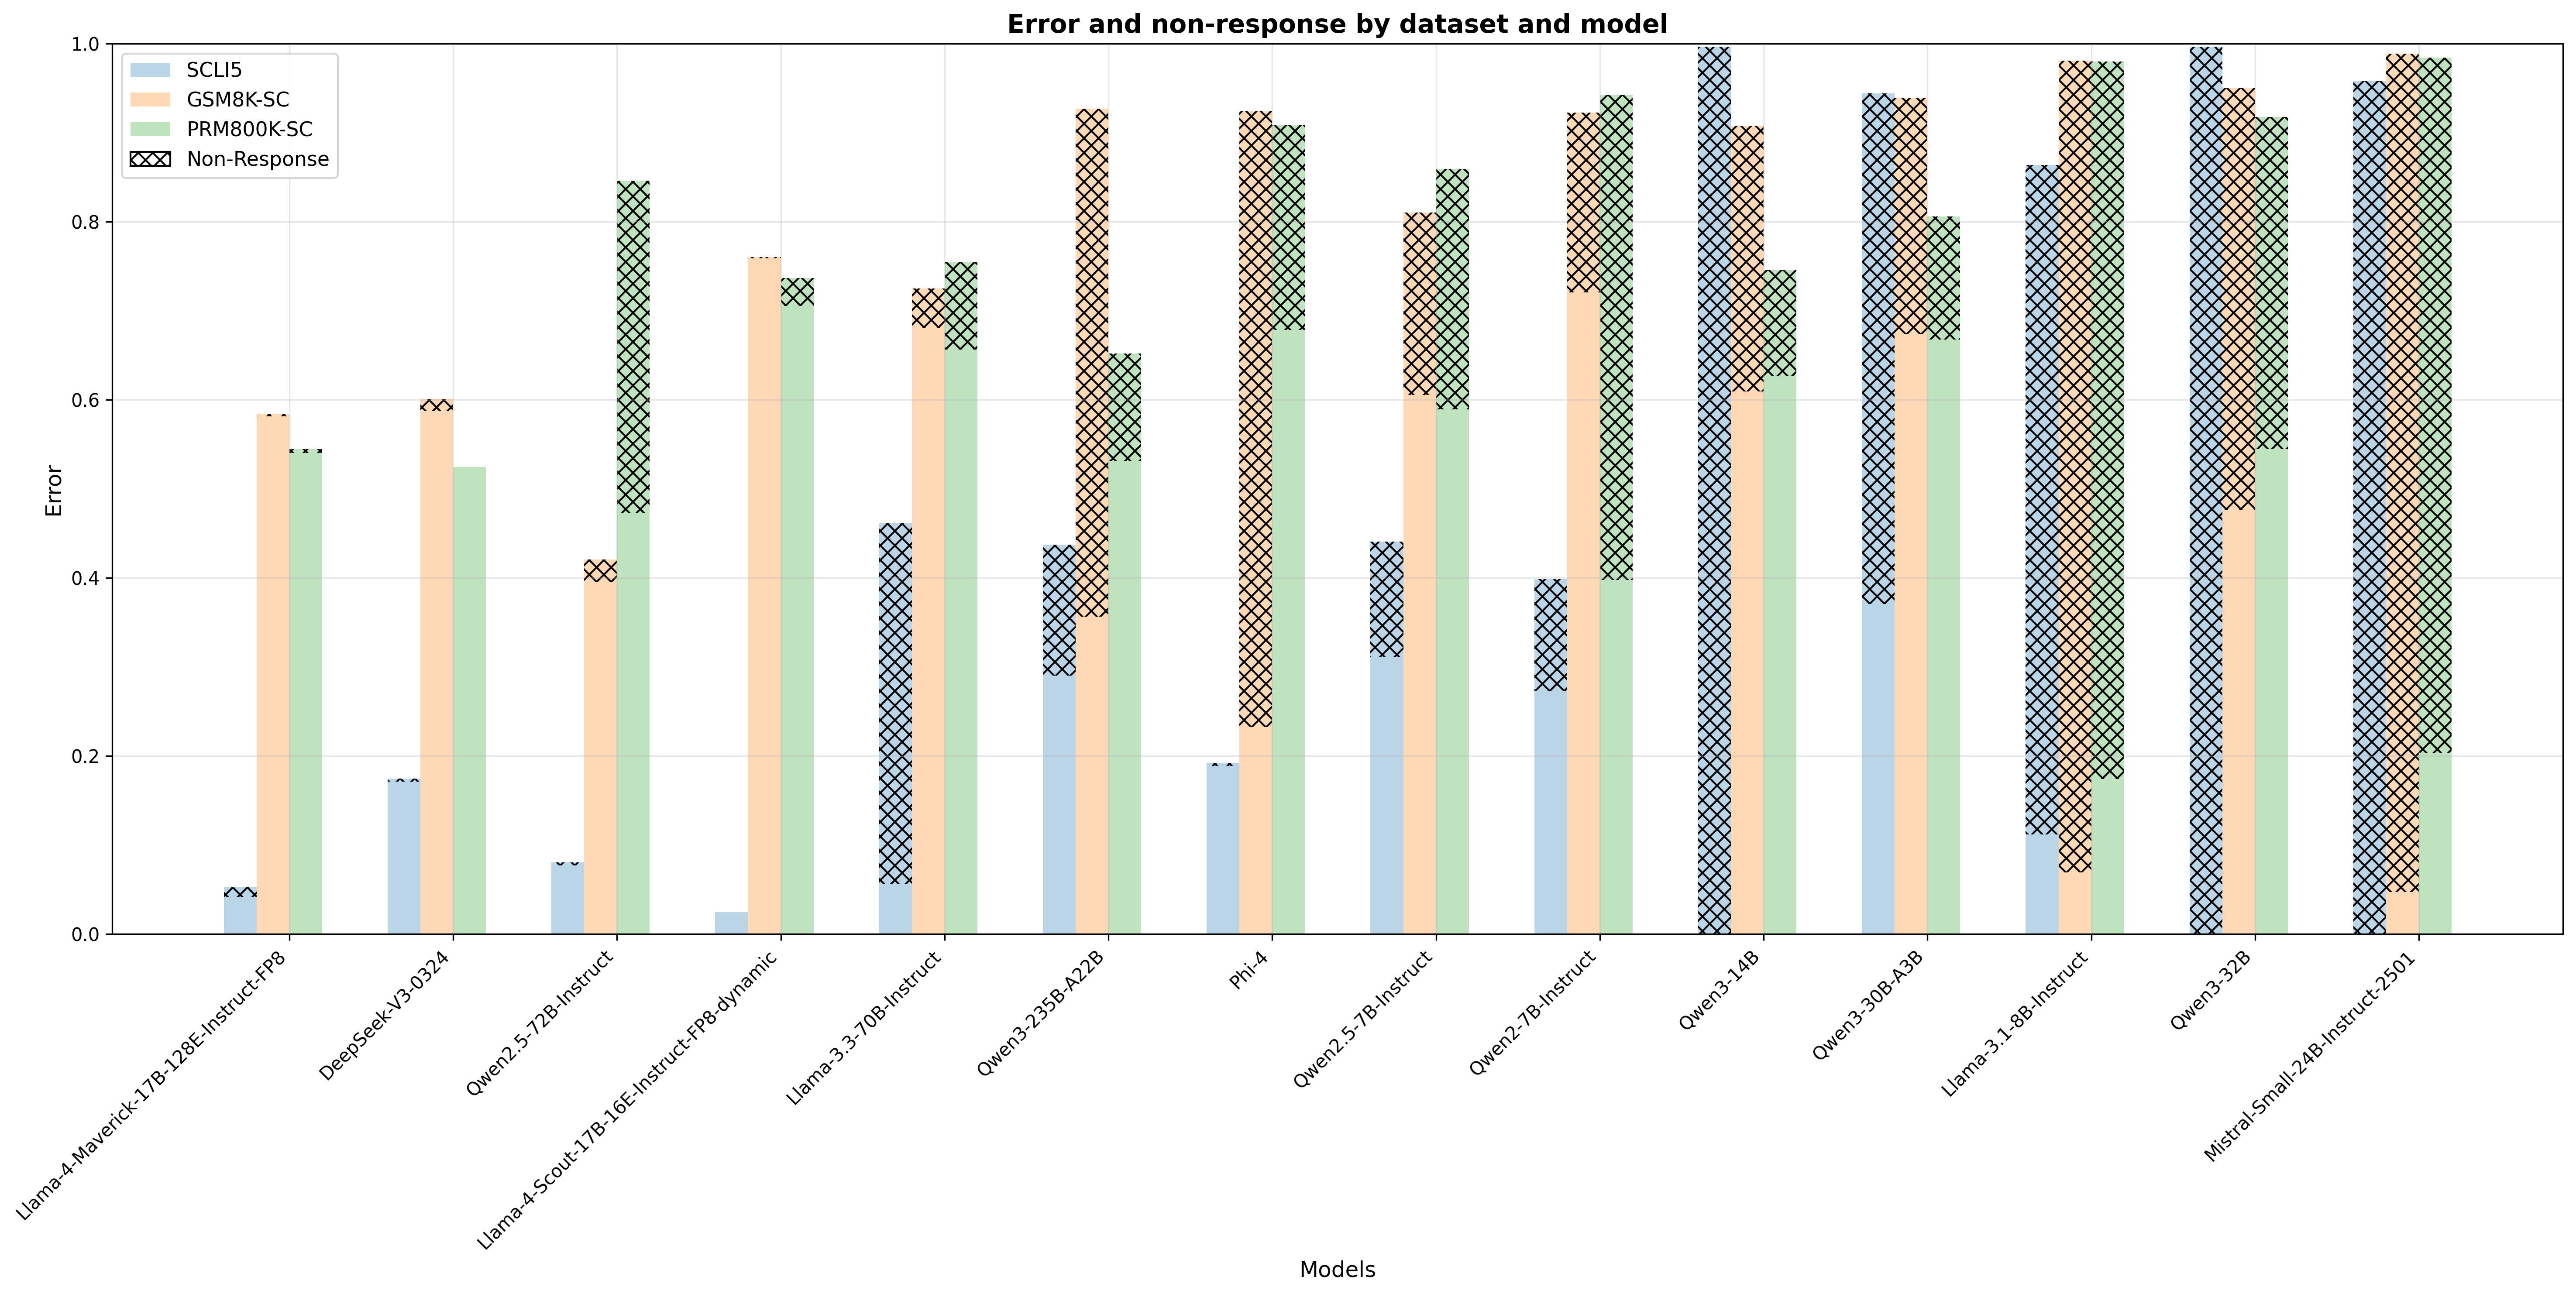
## Bar Chart: Error and non-response by dataset and model
### Overview
The image is a bar chart comparing the error rates and non-response rates of various language models across different datasets. The chart displays error on the y-axis and model names on the x-axis. Each model has four bars representing the SCLI5, GSM8K-SC, PRM800K-SC datasets, and the non-response rate.
### Components/Axes
* **Title:** Error and non-response by dataset and model
* **X-axis:** Models (Llama-4-Maverick-17B-128E-Instruct-FP8, DeepSeek-V3-0324, Qwen2.5-72B-Instruct, Llama-4-Scout-17B-16E-Instruct-FP8-dynamic, Llama-3.3-70B-Instruct, Qwen3-235B-A22B, Phi-4, Qwen2.5-7B-Instruct, Qwen2-7B-Instruct, Qwen3-14B, Qwen3-30B-A3B, Llama-3.1-8B-Instruct, Qwen3-32B, Mistral-Small-24B-Instruct-2501)
* **Y-axis:** Error (Scale: 0.0 to 1.0, incrementing by 0.2)
* **Legend:** Located at the top-left of the chart.
* SCLI5 (Light Blue)
* GSM8K-SC (Light Orange)
* PRM800K-SC (Light Green)
* Non-Response (Cross-hatched)
### Detailed Analysis
The chart presents error rates for different models across four datasets (SCLI5, GSM8K-SC, PRM800K-SC) and their non-response rates.
Here's a breakdown of the data for each model:
* **Llama-4-Maverick-17B-128E-Instruct-FP8:**
* SCLI5: ~0.01
* GSM8K-SC: ~0.58
* PRM800K-SC: ~0.55
* Non-Response: ~0.54
* **DeepSeek-V3-0324:**
* SCLI5: ~0.17
* GSM8K-SC: ~0.59
* PRM800K-SC: ~0.52
* Non-Response: ~0.07
* **Qwen2.5-72B-Instruct:**
* SCLI5: ~0.01
* GSM8K-SC: ~0.41
* PRM800K-SC: ~0.72
* Non-Response: ~0.41
* **Llama-4-Scout-17B-16E-Instruct-FP8-dynamic:**
* SCLI5: ~0.02
* GSM8K-SC: ~0.78
* PRM800K-SC: ~0.74
* Non-Response: ~0.75
* **Llama-3.3-70B-Instruct:**
* SCLI5: ~0.04
* GSM8K-SC: ~0.74
* PRM800K-SC: ~0.71
* Non-Response: ~0.76
* **Qwen3-235B-A22B:**
* SCLI5: ~0.30
* GSM8K-SC: ~0.68
* PRM800K-SC: ~0.50
* Non-Response: ~0.42
* **Phi-4:**
* SCLI5: ~0.18
* GSM8K-SC: ~0.70
* PRM800K-SC: ~0.28
* Non-Response: ~0.89
* **Qwen2.5-7B-Instruct:**
* SCLI5: ~0.31
* GSM8K-SC: ~0.45
* PRM800K-SC: ~0.84
* Non-Response: ~0.90
* **Qwen2-7B-Instruct:**
* SCLI5: ~0.27
* GSM8K-SC: ~0.72
* PRM800K-SC: ~0.93
* Non-Response: ~0.96
* **Qwen3-14B:**
* SCLI5: ~0.93
* GSM8K-SC: ~0.75
* PRM800K-SC: ~0.37
* Non-Response: ~0.98
* **Qwen3-30B-A3B:**
* SCLI5: ~0.92
* GSM8K-SC: ~0.95
* PRM800K-SC: ~0.91
* Non-Response: ~0.94
* **Llama-3.1-8B-Instruct:**
* SCLI5: ~0.50
* GSM8K-SC: ~0.92
* PRM800K-SC: ~0.96
* Non-Response: ~0.98
* **Qwen3-32B:**
* SCLI5: ~0.97
* GSM8K-SC: ~0.93
* PRM800K-SC: ~0.89
* Non-Response: ~0.99
* **Mistral-Small-24B-Instruct-2501:**
* SCLI5: ~0.01
* GSM8K-SC: ~0.98
* PRM800K-SC: ~0.92
* Non-Response: ~0.99
### Key Observations
* The SCLI5 dataset generally has lower error rates compared to GSM8K-SC and PRM800K-SC for most models.
* Non-response rates vary significantly across models, with some models exhibiting very high non-response rates.
* Models like Qwen3-14B, Qwen3-30B-A3B, Llama-3.1-8B-Instruct, Qwen3-32B, and Mistral-Small-24B-Instruct-2501 show high error and non-response rates across all datasets.
* DeepSeek-V3-0324 has a very low non-response rate compared to other models.
### Interpretation
The bar chart provides a comparative analysis of the performance of different language models on various datasets, considering both error rates and non-response rates. The data suggests that the choice of model and dataset significantly impacts performance. Some models are more prone to errors or non-responses depending on the dataset they are evaluated on. The high non-response rates observed in some models indicate potential issues with the model's ability to handle certain types of queries or data. The SCLI5 dataset appears to be less challenging for most models, resulting in lower error rates.