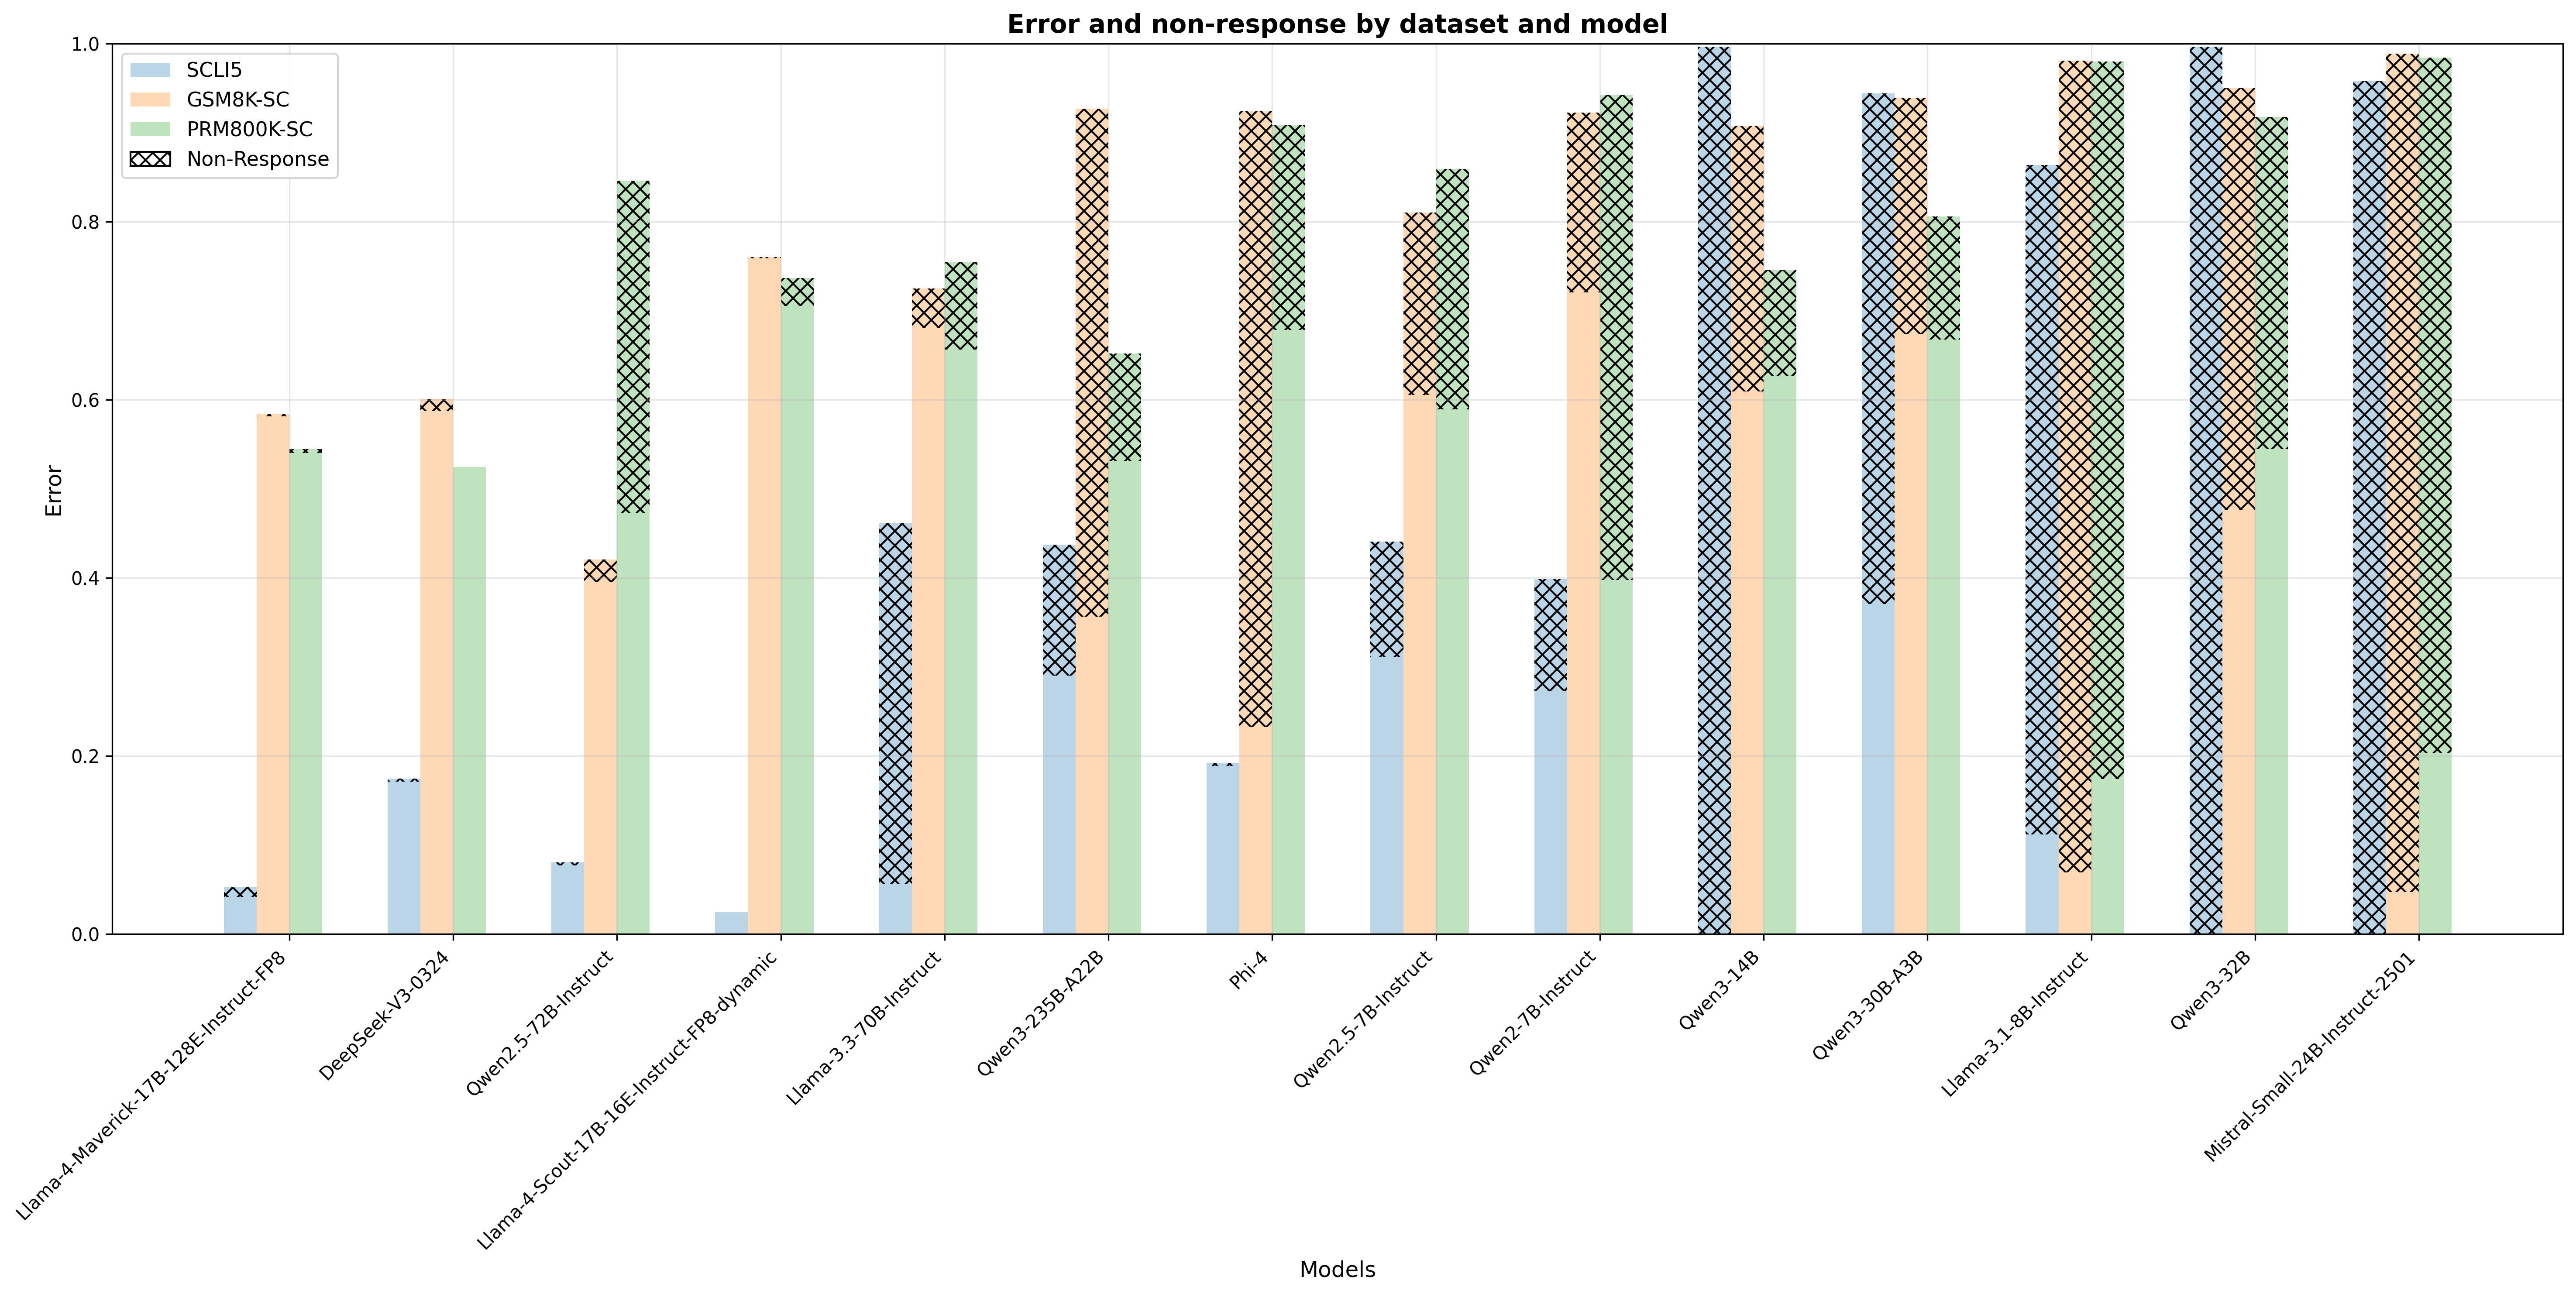
## [Bar Chart]: Error and Non-Response by Dataset and Model
### Overview
The chart visualizes **error rates** (y-axis, labeled "Error") and **non-response rates** (black cross-hatching) for 14 models (x-axis) across three datasets: *SCLI5* (light blue), *GSM8K-SC* (peach), and *PRM800K-SC* (light green). The y-axis ranges from 0.0 to 1.0, representing the combined rate of "error" (response with error) and "non-response" (no response).
### Components/Axes
- **Title**: "Error and non-response by dataset and model"
- **Y-axis**: "Error" (scale: 0.0–1.0, increments of 0.2)
- **X-axis**: "Models" (14 models, left to right):
1. Llama-4-Maverick-17B-128E-Instruct-FP8
2. DeepSeek-V3-0324
3. Qwen2.5-72B-Instruct
4. Llama-4-Scout-17B-16E-Instruct-FP8-dynamic
5. Llama-3.3-70B-Instruct
6. Qwen3-235B-A22B
7. Phi-4
8. Qwen2.5-7B-Instruct
9. Qwen2-7B-Instruct
10. Qwen3-14B
11. Qwen3-30B-A3B
12. Llama-3.1-8B-Instruct
13. Qwen3-32B
14. Mistral-Small-24B-Instruct-2501
- **Legend**:
- *SCLI5*: Light blue bars (error: response with error)
- *GSM8K-SC*: Peach bars (error: response with error)
- *PRM800K-SC*: Light green bars (error: response with error)
- *Non-Response*: Black cross-hatching (no response, overlaid on bars)
### Detailed Analysis (Model-by-Model, Dataset-by-Dataset)
For each model, we analyze three datasets (SCLI5, GSM8K-SC, PRM800K-SC) with two components: **solid color** (error: response with error) and **cross-hatching** (non-response: no response). The total height of each bar is the sum of error and non-response.
| Model | SCLI5 (Blue) | GSM8K-SC (Peach) | PRM800K-SC (Green) |
|--------------------------------|--------------------|--------------------|--------------------|
| **Llama-4-Maverick-17B-128E-Instruct-FP8** | Error: ~0.05; Non-Response: ~0.00 | Error: ~0.58; Non-Response: ~0.00 | Error: ~0.54; Non-Response: ~0.00 |
| **DeepSeek-V3-0324** | Error: ~0.17; Non-Response: ~0.00 | Error: ~0.60; Non-Response: ~0.00 | Error: ~0.52; Non-Response: ~0.00 |
| **Qwen2.5-72B-Instruct** | Error: ~0.08; Non-Response: ~0.00 | Error: ~0.41; Non-Response: ~0.00 | Error: ~0.47; Non-Response: ~0.00 |
| **Llama-4-Scout-17B-16E-Instruct-FP8-dynamic** | Error: ~0.02; Non-Response: ~0.00 | Error: ~0.76; Non-Response: ~0.00 | Error: ~0.73; Non-Response: ~0.00 |
| **Llama-3.3-70B-Instruct** | Error: ~0.05; Non-Response: ~0.00 | Error: ~0.72; Non-Response: ~0.00 | Error: ~0.75; Non-Response: ~0.00 |
| **Qwen3-235B-A22B** | Error: ~0.30; Non-Response: ~0.13 | Error: ~0.35; Non-Response: ~0.57 | Error: ~0.53; Non-Response: ~0.12 |
| **Phi-4** | Error: ~0.19; Non-Response: ~0.01 | Error: ~0.23; Non-Response: ~0.69 | Error: ~0.68; Non-Response: ~0.23 |
| **Qwen2.5-7B-Instruct** | Error: ~0.31; Non-Response: ~0.13 | Error: ~0.60; Non-Response: ~0.21 | Error: ~0.68; Non-Response: ~0.18 |
| **Qwen2-7B-Instruct** | Error: ~0.27; Non-Response: ~0.13 | Error: ~0.72; Non-Response: ~0.20 | Error: ~0.40; Non-Response: ~0.54 |
| **Qwen3-14B** | Error: ~0.37; Non-Response: ~0.63 | Error: ~0.61; Non-Response: ~0.30 | Error: ~0.63; Non-Response: ~0.12 |
| **Qwen3-30B-A3B** | Error: ~0.37; Non-Response: ~0.57 | Error: ~0.68; Non-Response: ~0.26 | Error: ~0.67; Non-Response: ~0.13 |
| **Llama-3.1-8B-Instruct** | Error: ~0.12; Non-Response: ~0.74 | Error: ~0.07; Non-Response: ~0.91 | Error: ~0.18; Non-Response: ~0.80 |
| **Qwen3-32B** | Error: ~0.00; Non-Response: ~1.00 | Error: ~0.48; Non-Response: ~0.47 | Error: ~0.55; Non-Response: ~0.37 |
| **Mistral-Small-24B-Instruct-2501** | Error: ~0.00; Non-Response: ~0.96 | Error: ~0.05; Non-Response: ~0.94 | Error: ~0.20; Non-Response: ~0.79 |
### Key Observations
1. **Non-Response Dominance in Later Models**:
- Earlier models (left) have minimal non-response (cross-hatching), so error rates (solid color) are visible.
- Later models (right) have **high non-response** (cross-hatching dominates), making total "error" (error + non-response) approach 1.0.
2. **Dataset-Specific Trends**:
- *SCLI5* (blue): Low error in early models, but non-response dominates in later models (e.g., Qwen3-14B, Qwen3-32B).
- *GSM8K-SC* (peach): Moderate error in early models, with non-response increasing sharply in later models (e.g., Llama-3.1-8B-Instruct, Mistral-Small-24B-Instruct-2501).
- *PRM800K-SC* (green): Moderate error in early models, with non-response increasing in later models (less than GSM8K-SC).
3. **Model Generation Shift**:
- Early models (e.g., Llama-4-Maverick, DeepSeek-V3) prioritize responding (low non-response) but have moderate error.
- Later models (e.g., Qwen3-14B, Mistral-Small-24B-Instruct-2501) prioritize non-response (abstaining) over incorrect responses, leading to high total "error."
### Interpretation
The chart reveals a **trade-off between error (response with error) and non-response (no response)** across models and datasets:
- **Early Models**: Focus on responding (low non-response) but struggle with accuracy (moderate error), especially on *GSM8K-SC* and *PRM800K-SC* (reasoning-heavy datasets).
- **Later Models**: Shift toward non-response (abstaining) to avoid incorrect answers, leading to high total "error" (since non-response is counted as a failure). This suggests a design choice (e.g., models trained to avoid wrong answers) or a limitation (e.g., models struggle with the dataset and fail to generate a response).
- **Dataset Complexity**: *GSM8K-SC* (math reasoning) and *PRM800K-SC* (reasoning) are more challenging, driving both error and non-response. *SCLI5* (possibly simpler) sees low error in early models but high non-response in later ones, indicating a shift in model behavior.
This analysis highlights how model performance (error + non-response) evolves with generation and dataset, with non-response becoming a critical factor in later models.