## Bar Chart: Error and non-response by dataset and model
### Overview
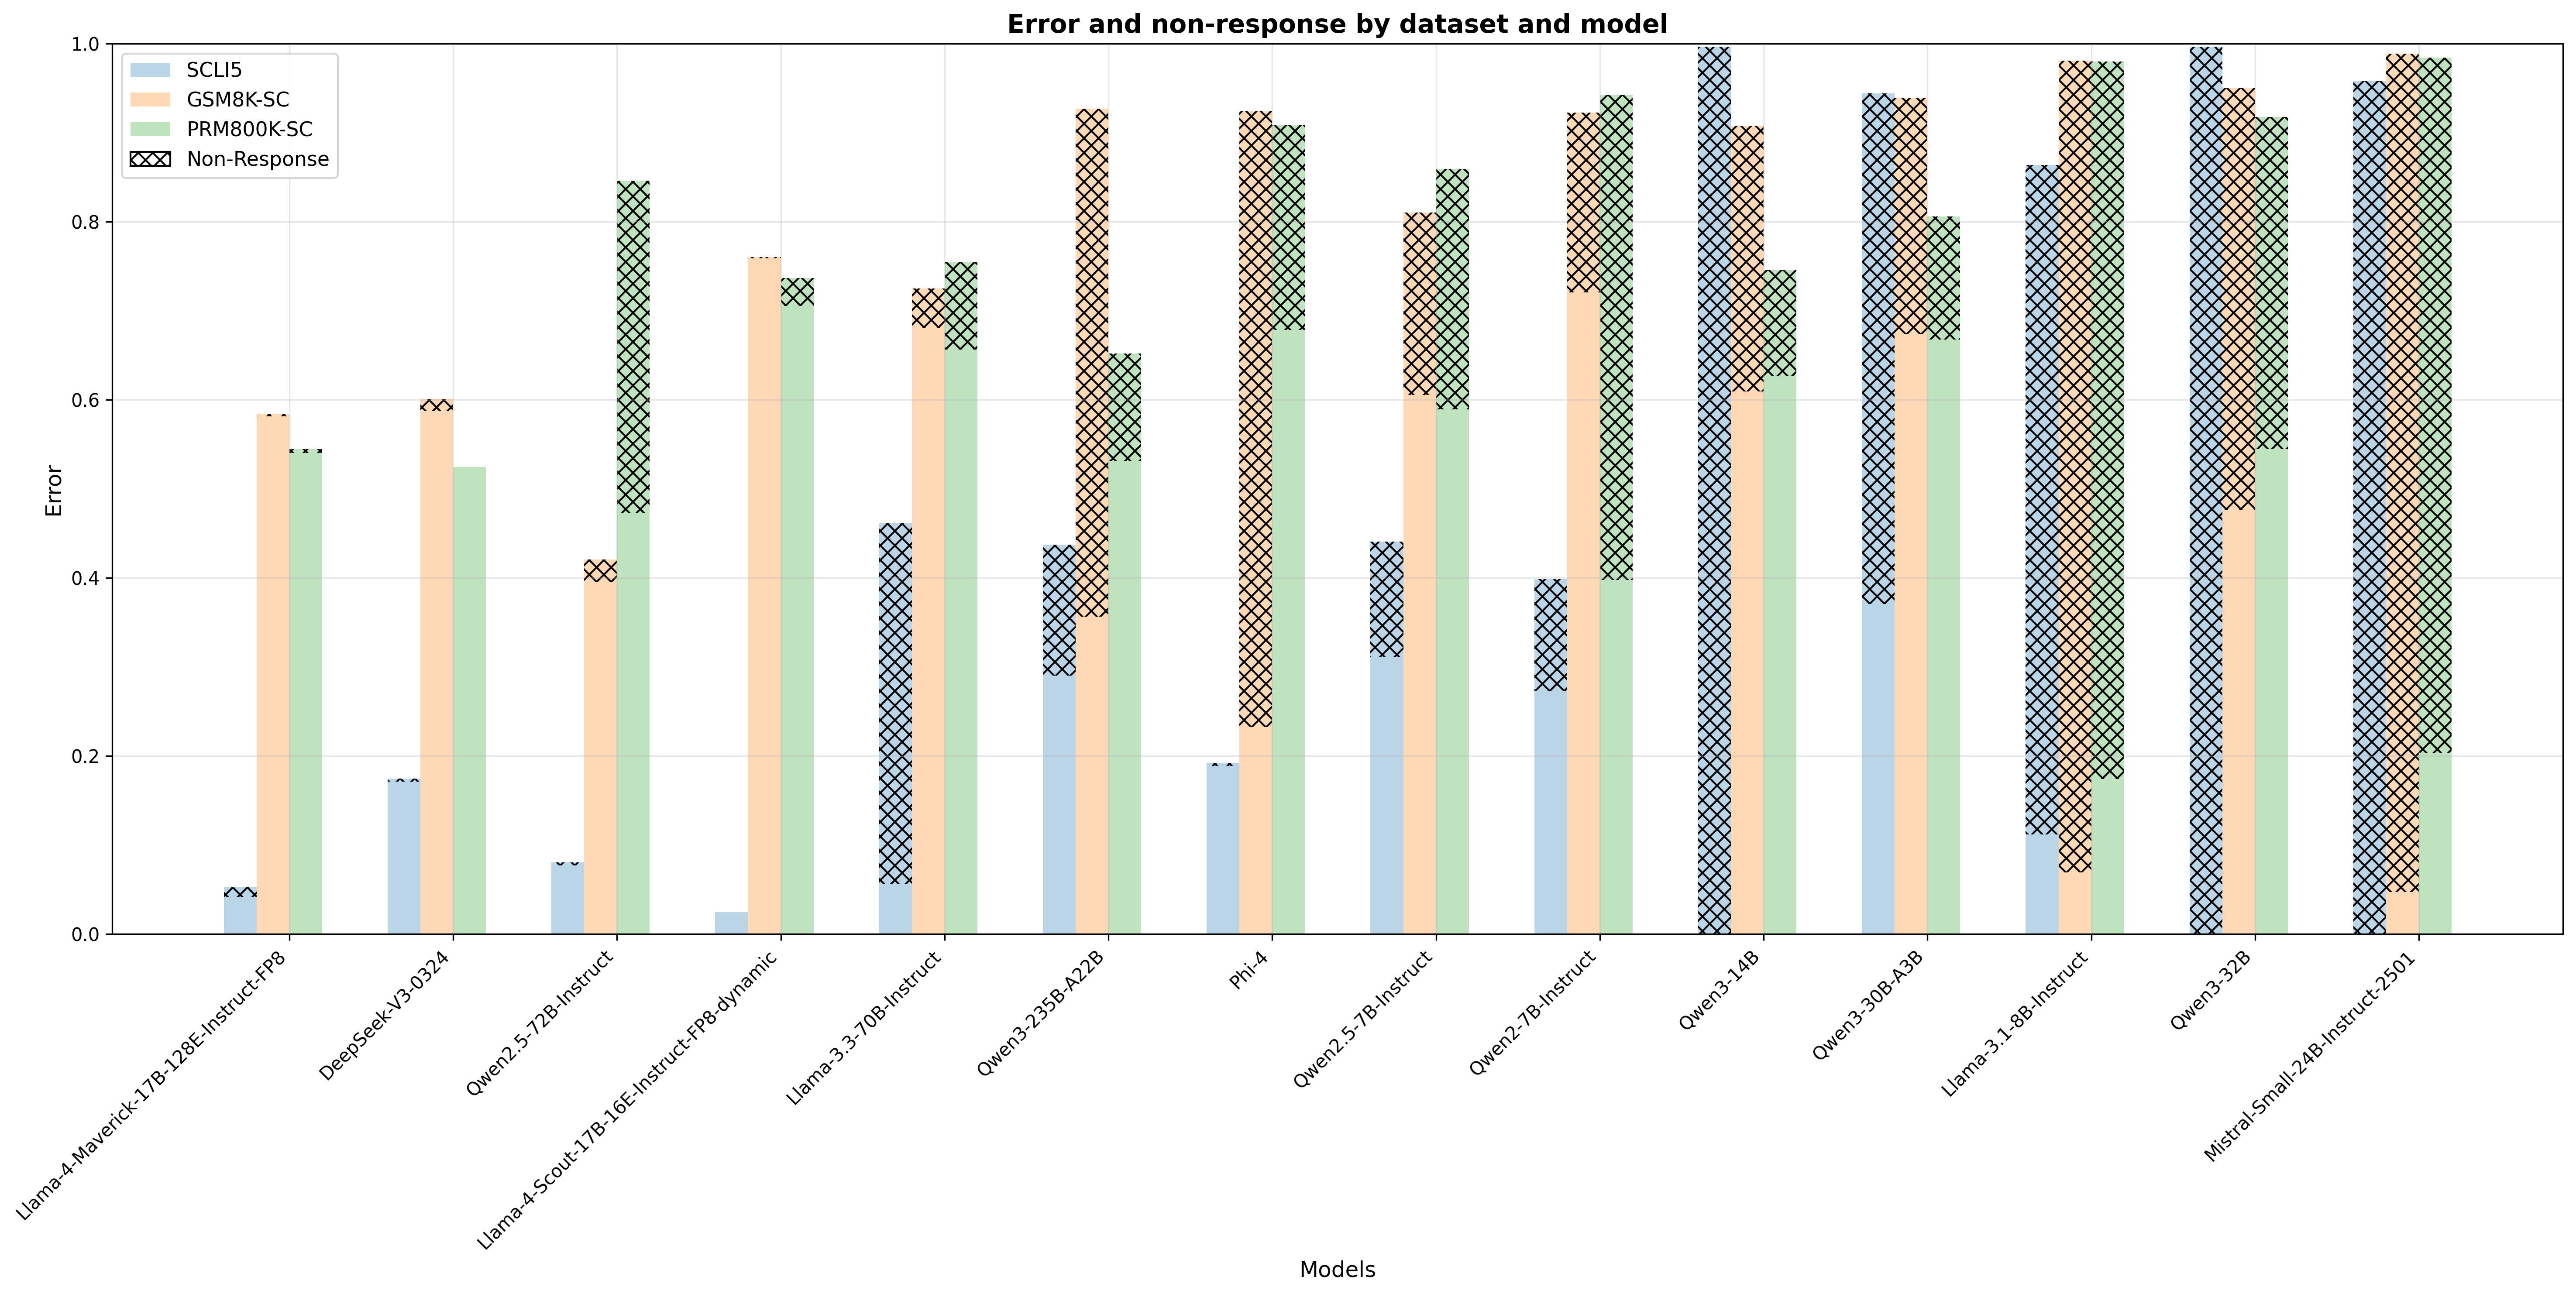
The chart compares error rates and non-response frequencies across 15 AI models evaluated on three datasets (SCLI5, GSM8K-SC, PRM800K-SC). Each model's performance is visualized through stacked bars with distinct color coding for error components and crosshatched patterns representing non-response.
### Components/Axes
- **X-axis**: Model names (e.g., Llama-4-Maverick-17B-128E-Instruct-FP8, DeepSeek-V3-0324, Mistral-Small-24B-Instruct-2501)
- **Y-axis**: Error magnitude (0.0 to 1.0 scale)
- **Legend**:
- Blue: SCLI5 errors
- Orange: GSM8K-SC errors
- Green: PRM800K-SC errors
- Crosshatched: Non-response errors
- **Bar Structure**: Three colored segments per model (error components) + crosshatched overlay (non-response)
### Detailed Analysis
1. **Llama-4-Maverick-17B-128E-Instruct-FP8**
- SCLI5: ~0.05
- GSM8K-SC: ~0.58
- PRM800K-SC: ~0.55
- Non-response: ~0.02
2. **DeepSeek-V3-0324**
- SCLI5: ~0.18
- GSM8K-SC: ~0.60
- PRM800K-SC: ~0.52
- Non-response: ~0.03
3. **Qwen2.5-72B-Instruct**
- SCLI5: ~0.08
- GSM8K-SC: ~0.40
- PRM800K-SC: ~0.85
- Non-response: ~0.07
4. **Llama-3-70B-Instruct**
- SCLI5: ~0.45
- GSM8K-SC: ~0.70
- PRM800K-SC: ~0.65
- Non-response: ~0.15
5. **Qwen3-235B-A22B**
- SCLI5: ~0.30
- GSM8K-SC: ~0.90
- PRM800K-SC: ~0.60
- Non-response: ~0.20
6. **Phi-4**
- SCLI5: ~0.20
- GSM8K-SC: ~0.70
- PRM800K-SC: ~0.90
- Non-response: ~0.45
7. **Qwen2.5-7B-Instruct**
- SCLI5: ~0.35
- GSM8K-SC: ~0.80
- PRM800K-SC: ~0.70
- Non-response: ~0.15
8. **Qwen2.7B-Instruct**
- SCLI5: ~0.25
- GSM8K-SC: ~0.90
- PRM800K-SC: ~0.80
- Non-response: ~0.20
9. **Qwen3-14B**
- SCLI5: ~1.00
- GSM8K-SC: ~0.80
- PRM800K-SC: ~0.70
- Non-response: ~0.50
10. **Qwen3-30B-A3B**
- SCLI5: ~0.80
- GSM8K-SC: ~0.90
- PRM800K-SC: ~0.80
- Non-response: ~0.30
11. **Llama-3-8B-Instruct**
- SCLI5: ~0.10
- GSM8K-SC: ~0.90
- PRM800K-SC: ~0.80
- Non-response: ~0.20
12. **Owen3-32B**
- SCLI5: ~0.98
- GSM8K-SC: ~0.95
- PRM800K-SC: ~0.90
- Non-response: ~0.05
13. **Mistral-Small-24B-Instruct-2501**
- SCLI5: ~0.95
- GSM8K-SC: ~0.98
- PRM800K-SC: ~0.95
- Non-response: ~0.05
### Key Observations
1. **Non-response Patterns**:
- Highest non-response in Phi-4 (~45% of total error)
- Lowest in Llama-4-Maverick (~2% of total error)
- Crosshatched patterns occupy 20-50% of total error for most models
2. **Error Distribution**:
- GSM8K-SC consistently shows highest error rates (0.4-0.9 range)
- SCLI5 demonstrates lowest error rates (0.05-0.3 range)
- PRM800K-SC errors cluster between 0.5-0.9 range
3. **Model Performance**:
- Llama-4-Maverick shows best overall performance (lowest error + non-response)
- Qwen3-14B exhibits worst performance (100% SCLI5 error)
- Mistral-Small-24B has highest combined error (98% GSM8K-SC)
### Interpretation
The data reveals significant variability in model performance across datasets. Non-response errors (crosshatched) appear particularly problematic for larger models like Phi-4 and Qwen3-14B, suggesting potential issues with handling edge cases or ambiguous inputs. The consistent underperformance on GSM8K-SC across all models indicates this dataset may contain more complex or ambiguous queries.
The color-coded error components allow for direct comparison of dataset-specific weaknesses. For instance, while Llama-4-Maverick performs well overall, its GSM8K-SC error (~0.58) matches its PRM800K-SC error (~0.55), suggesting balanced but suboptimal performance on reasoning tasks. In contrast, Qwen3-235B-A22B shows disproportionate GSM8K-SC errors (90%) compared to PRM800K-SC (60%), indicating dataset-specific limitations.
The non-response pattern correlates with model complexity - larger models (e.g., Qwen3-235B) show higher non-response rates, possibly due to increased sensitivity to input formatting or computational constraints during inference.