# Technical Data Extraction: Performance vs. Effective Context Length
This document provides a detailed technical extraction of the provided image, which consists of two side-by-side line charts comparing different Retrieval-Augmented Generation (RAG) configurations.
## 1. Global Chart Metadata
* **Y-Axis Label:** Normalized Performance
* **Y-Axis Scale:** Linear, ranging from -2 to 2 (with major ticks at -2, -1, 0, 1, 2).
* **X-Axis Label:** Effective Context Length
* **X-Axis Scale:** Logarithmic ($10^2$ to $10^6$).
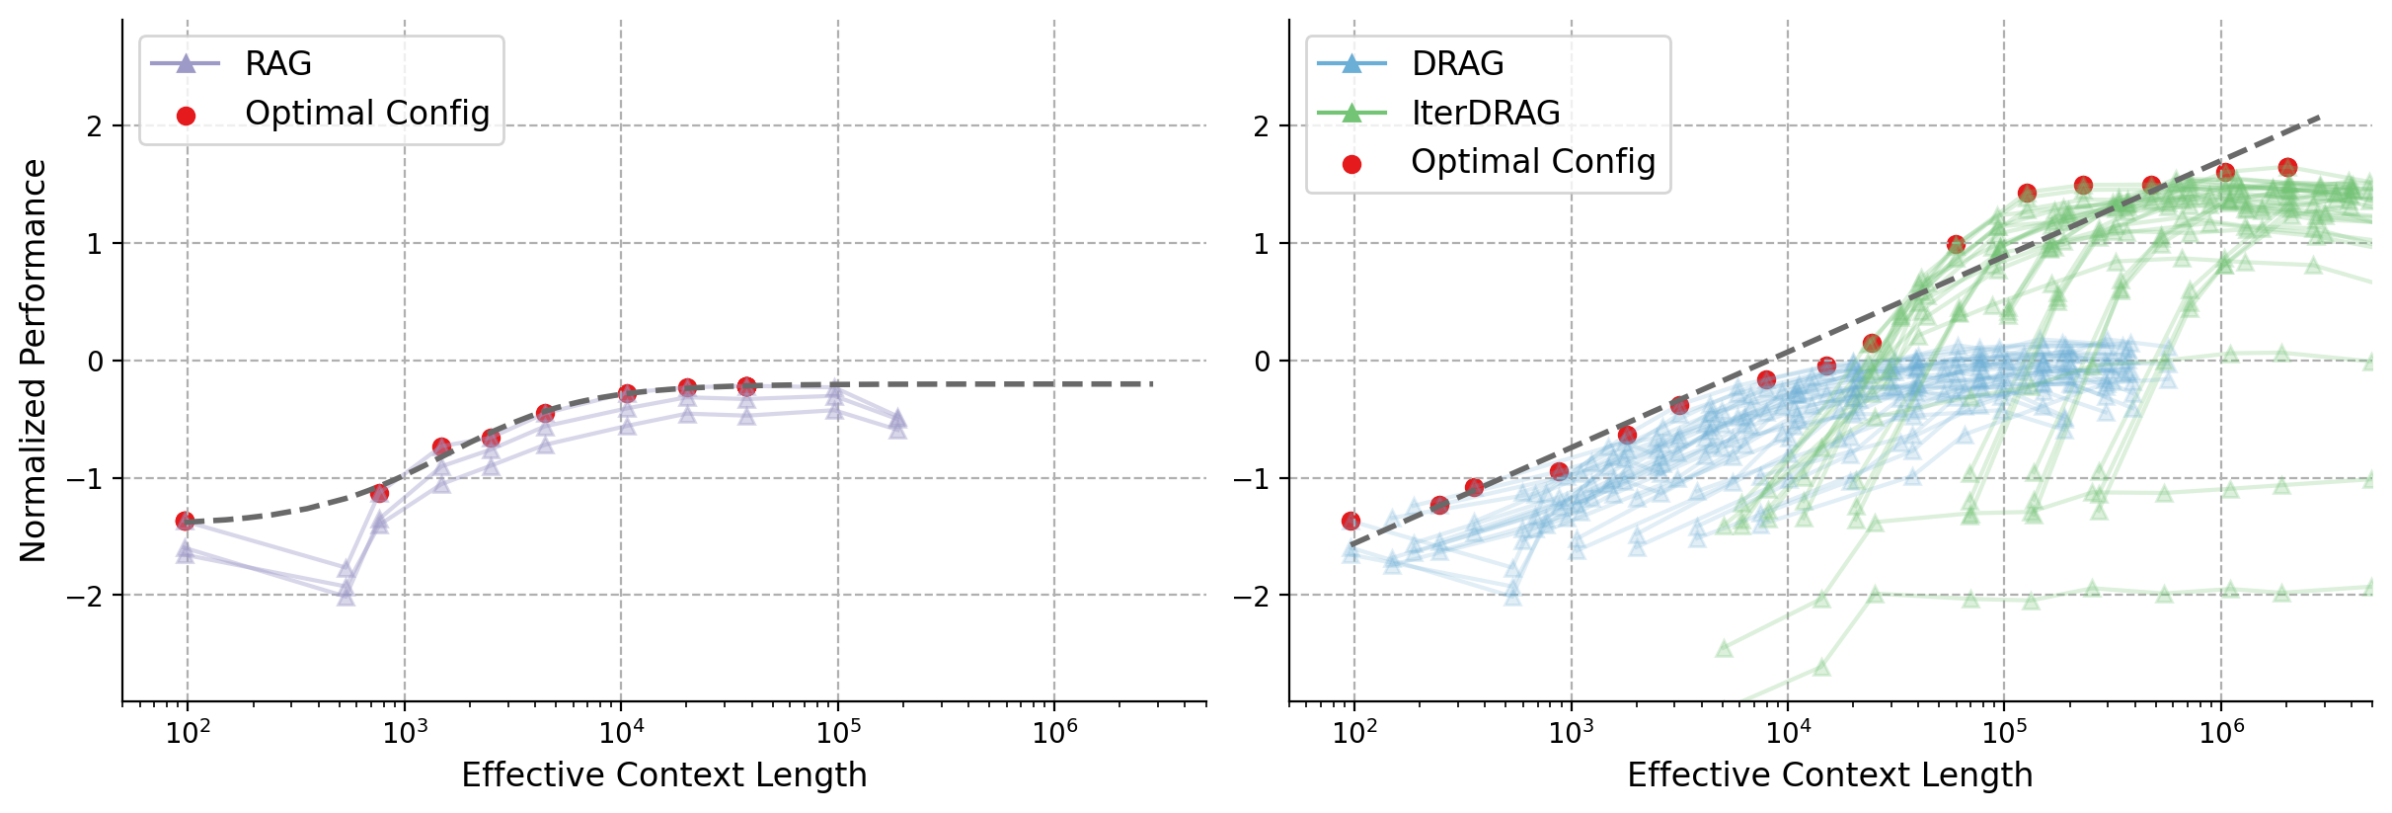
* **Visual Style:** White background with a grey dashed grid. A dark grey dashed line represents the "Pareto frontier" or the upper bound of performance across all configurations in both plots.
---
## 2. Left Plot: RAG Performance
This plot focuses on standard RAG configurations.
### Legend Information
* **Location:** Top-left [x: ~0.05, y: ~0.90]
* **Series 1:** `RAG` (Light purple line with triangle markers $\triangle$).
* **Series 2:** `Optimal Config` (Red solid circles $\bullet$).
### Component Analysis & Trends
* **Trend Verification:** The RAG data series (purple lines) show an initial dip between $10^2$ and $10^3$, followed by a steady upward slope as context length increases, eventually plateauing around $10^4$ to $10^5$.
* **Data Points (Approximate):**
* **Initial State ($10^2$):** Performance starts at approximately -1.4.
* **The Dip ($5 \times 10^2$):** Performance drops to its lowest point, approximately -2.0.
* **Recovery ($10^3$):** Performance rises sharply to approximately -1.0.
* **Plateau ($10^4$ - $10^5$):** Performance stabilizes between -0.5 and -0.2.
* **Optimal Config (Red Dots):** These track the highest-performing purple line at each context interval, following the dark grey dashed trend line.
---
## 3. Right Plot: DRAG and IterDRAG Performance
This plot introduces more complex configurations (DRAG and IterDRAG) and extends the context length further.
### Legend Information
* **Location:** Top-left [x: ~0.55, y: ~0.90]
* **Series 1:** `DRAG` (Light blue line with triangle markers $\triangle$).
* **Series 2:** `IterDRAG` (Light green line with triangle markers $\triangle$).
* **Series 3:** `Optimal Config` (Red solid circles $\bullet$).
### Component Analysis & Trends
* **Trend Verification (DRAG - Blue):** These lines follow a similar trajectory to the standard RAG in the left plot but are shifted slightly higher. They trend upward from $10^2$ and plateau around $10^4$ to $10^5$ at a performance level near 0.
* **Trend Verification (IterDRAG - Green):** These lines represent the highest scaling potential. While some configurations start low (below -2), the successful configurations slope steeply upward starting at $10^4$, surpassing both RAG and DRAG.
* **Trend Verification (Optimal Config - Red):** The red dots follow a strong, consistent upward linear-log trend (the dark grey dashed line), showing that as context length increases to $10^6$, performance continues to scale.
### Data Points (Approximate)
| Effective Context Length | Optimal Performance (Red Dots) | Dominant Series |
| :--- | :--- | :--- |
| $10^2$ | ~ -1.4 | DRAG |
| $10^3$ | ~ -0.9 | DRAG |
| $10^4$ | ~ -0.2 | DRAG / IterDRAG Transition |
| $10^5$ | ~ +1.0 | IterDRAG |
| $10^6$ | ~ +1.5 | IterDRAG |
| $2 \times 10^6$ | ~ +1.6 | IterDRAG |
---
## 4. Comparative Summary
* **Scaling:** Standard **RAG** (Left) plateaus early and does not benefit significantly from context lengths beyond $10^4$.
* **Advanced Methods:** **DRAG** (Blue) improves upon RAG but also reaches a ceiling.
* **Superiority of IterDRAG:** **IterDRAG** (Green) is the only method shown that continues to scale performance effectively into the "Long Context" regime ($10^5$ to $10^6$), defining the upper bound of the "Optimal Config" trend line in the high-context regions.
* **The Pareto Frontier:** The dark grey dashed line indicates a logarithmic relationship between effective context length and normalized performance, which is only achievable by switching from standard RAG to IterDRAG as context grows.