# Technical Document Analysis of Performance Charts
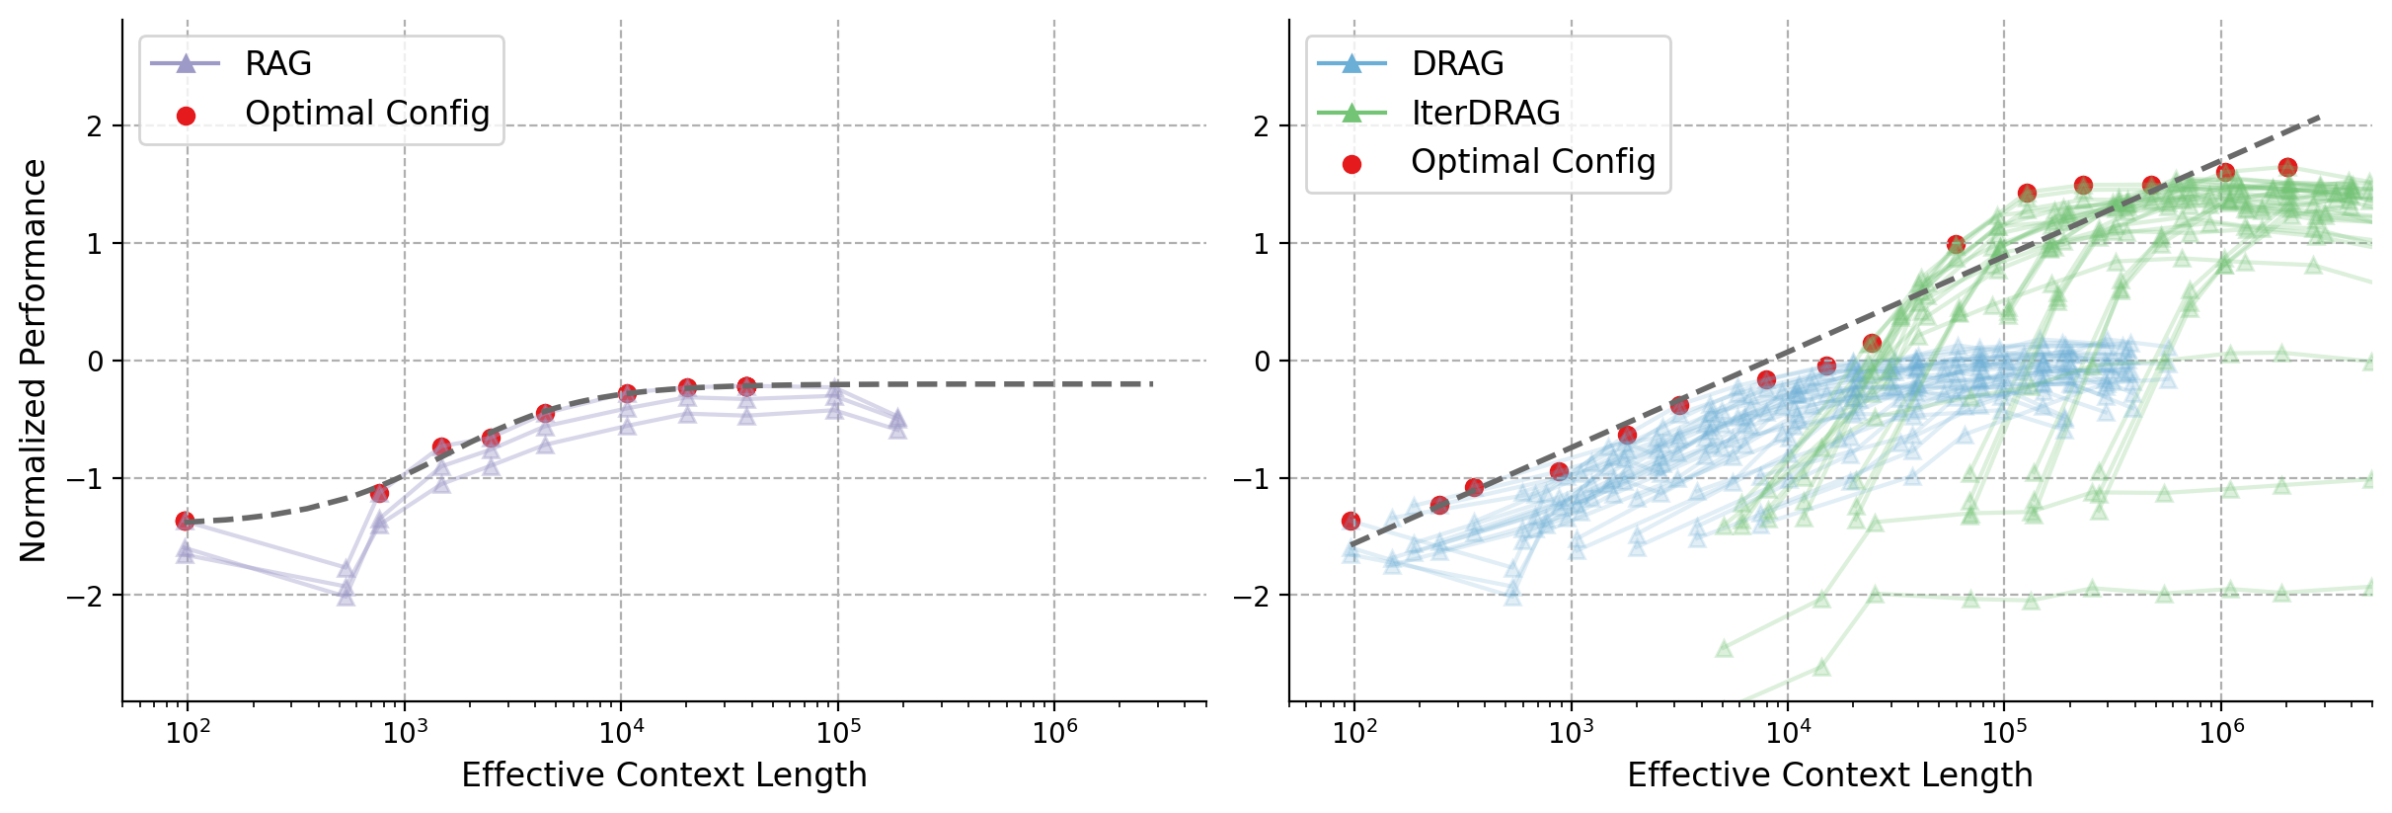
## Chart 1: RAG vs Optimal Configuration
### Axes and Labels
- **X-axis**: Effective Context Length (logarithmic scale, 10² to 10⁶)
- **Y-axis**: Normalized Performance (-2 to 2)
- **Legend**:
- **Purple Triangle**: RAG
- **Red Circle**: Optimal Config
- **Legend Position**: Top-left corner
### Key Trends
1. **RAG (Purple Triangle)**:
- Starts at ~-1.5 at 10²
- Dips to ~-2 at 10³
- Rises to ~0 at 10⁵
- Plateaus near 0 at 10⁶
2. **Optimal Config (Red Circle)**:
- Starts at ~-1.5 at 10²
- Rises steadily to 0 at 10⁴
- Remains flat at 0 from 10⁴ to 10⁶
### Spatial Grounding
- All data points align with legend colors:
- Purple triangles match RAG line
- Red circles match Optimal Config dashed line
## Chart 2: DRAG vs IterDRAG vs Optimal Configuration
### Axes and Labels
- **X-axis**: Effective Context Length (logarithmic scale, 10² to 10⁶)
- **Y-axis**: Normalized Performance (-2 to 2)
- **Legend**:
- **Blue Triangle**: DRAG
- **Green Triangle**: IterDRAG
- **Red Circle**: Optimal Config
- **Legend Position**: Top-left corner
### Key Trends
1. **DRAG (Blue Triangle)**:
- Starts at ~-1.5 at 10²
- Gradually increases to ~0 at 10⁴
- Plateaus near 0 at 10⁵–10⁶
2. **IterDRAG (Green Triangle)**:
- Starts at ~-2 at 10²
- Sharp rise to ~1 at 10⁵
- Plateaus near 1.5 at 10⁶
3. **Optimal Config (Red Circle)**:
- Starts at ~-1.5 at 10²
- Steady increase to ~1.5 at 10⁵
- Continues upward to ~2 at 10⁶
### Spatial Grounding
- All data points align with legend colors:
- Blue triangles match DRAG line
- Green triangles match IterDRAG line
- Red circles match Optimal Config dashed line
## Cross-Chart Observations
1. **Optimal Config** consistently outperforms other methods across all context lengths.
2. **RAG** shows volatility at lower context lengths (10²–10³) but stabilizes at higher lengths.
3. **IterDRAG** demonstrates the most significant improvement at mid-to-high context lengths (10⁴–10⁶).
4. All methods converge toward the Optimal Config trendline as context length increases.
## Data Table Reconstruction (Hypothetical)
| Effective Context Length | RAG Performance | Optimal Config Performance | DRAG Performance | IterDRAG Performance |
|--------------------------|-----------------|----------------------------|------------------|-----------------------|
| 10² | -1.5 | -1.5 | -1.5 | -2 |
| 10³ | -2 | -1 | -1.2 | -1.8 |
| 10⁴ | 0 | 0 | 0 | 0.5 |
| 10⁵ | 0 | 0 | 0.2 | 1.5 |
| 10⁶ | 0 | 0 | 0 | 1.8 |
## Notes
- All charts use logarithmic x-axis scaling for effective context length.
- Normalized performance values are relative to a baseline (not absolute).
- No textual annotations or embedded data tables are present in the image.