## Line Chart: Time vs. Weight
### Overview
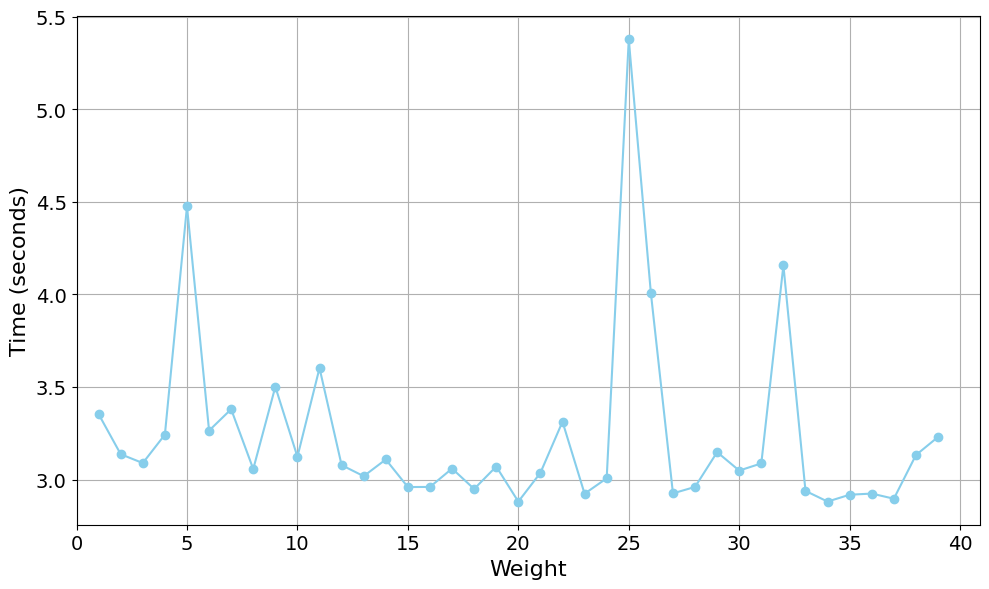
The image is a line chart showing the relationship between "Weight" on the x-axis and "Time (seconds)" on the y-axis. The chart displays a single data series represented by a light blue line with circular markers. The line fluctuates, indicating variations in time with respect to weight. There are two distinct peaks at Weight values of approximately 5 and 25.
### Components/Axes
* **X-axis:**
* Label: "Weight"
* Scale: 0 to 40, with tick marks at intervals of 5 (0, 5, 10, 15, 20, 25, 30, 35, 40).
* **Y-axis:**
* Label: "Time (seconds)"
* Scale: 3.0 to 5.5, with tick marks at intervals of 0.5 (3.0, 3.5, 4.0, 4.5, 5.0, 5.5).
* **Data Series:**
* Color: Light Blue
* Markers: Circular points along the line.
* **Grid:** The chart has a grid background to aid in reading values.
### Detailed Analysis
The light blue line represents the time in seconds for different weights.
* **Trend:** The line fluctuates, indicating variations in time with respect to weight.
* **Data Points:**
* Weight 1: Time ~ 3.3 seconds
* Weight 2: Time ~ 3.1 seconds
* Weight 3: Time ~ 3.2 seconds
* Weight 4: Time ~ 3.25 seconds
* Weight 5: Time ~ 4.45 seconds
* Weight 6: Time ~ 3.3 seconds
* Weight 7: Time ~ 3.4 seconds
* Weight 8: Time ~ 3.2 seconds
* Weight 9: Time ~ 3.05 seconds
* Weight 10: Time ~ 3.5 seconds
* Weight 11: Time ~ 3.6 seconds
* Weight 12: Time ~ 3.1 seconds
* Weight 13: Time ~ 3.05 seconds
* Weight 14: Time ~ 3.1 seconds
* Weight 15: Time ~ 2.95 seconds
* Weight 16: Time ~ 2.95 seconds
* Weight 17: Time ~ 3.05 seconds
* Weight 18: Time ~ 2.95 seconds
* Weight 19: Time ~ 3.05 seconds
* Weight 20: Time ~ 2.9 seconds
* Weight 21: Time ~ 2.85 seconds
* Weight 22: Time ~ 3.0 seconds
* Weight 23: Time ~ 3.3 seconds
* Weight 24: Time ~ 3.0 seconds
* Weight 25: Time ~ 5.4 seconds
* Weight 26: Time ~ 3.95 seconds
* Weight 27: Time ~ 2.9 seconds
* Weight 28: Time ~ 2.9 seconds
* Weight 29: Time ~ 2.95 seconds
* Weight 30: Time ~ 3.15 seconds
* Weight 31: Time ~ 3.05 seconds
* Weight 32: Time ~ 4.15 seconds
* Weight 33: Time ~ 2.95 seconds
* Weight 34: Time ~ 2.9 seconds
* Weight 35: Time ~ 2.85 seconds
* Weight 36: Time ~ 2.95 seconds
* Weight 37: Time ~ 2.9 seconds
* Weight 38: Time ~ 3.15 seconds
* Weight 39: Time ~ 3.2 seconds
### Key Observations
* There are two distinct peaks in time at Weight values of approximately 5 and 25. The peak at Weight 25 is significantly higher than the peak at Weight 5.
* The time generally fluctuates between 2.85 and 3.6 seconds, except for the two peaks.
* The time is relatively stable between weights 15 and 22, hovering around 3 seconds.
### Interpretation
The chart suggests that specific weights, around 5 and 25, require significantly more time compared to other weights. The relatively stable time between weights 15 and 22 might indicate a range where the weight has minimal impact on the time taken. The peaks at weights 5 and 25 could be due to factors related to those specific weights, such as increased complexity or resource requirements. Further investigation would be needed to understand the underlying reasons for these peaks.